The case for a metrics layer is as strong as it's ever been. The proliferation of AI-enabled analytics has made it easier than ever for vague questions to turn into answers and actions that look and feel data-driven, but are often misguided by lack of context. While the technology is new, the problem is a familiar one to the data industry. The fix is also familiar: the metrics layer — a governed, version-controlled set of metric definitions and pre-computed outputs that gives AI interfaces the precise business context required to return answers that are not just fast, but trustworthy and consistent.
Let's take a brief trip back to 2021.
At the time, the concept of a "metrics layer" had captured the data zeitgeist. The modern data stack made analytics dramatically more accessible, but that accessibility came with a hidden cost. Data teams were now managing a collection of specialized tools that were loosely connected but not fully integrated. Metrics, the outputs that data teams labored over the most to get right, could be carefully modeled in dbt, only to be represented slightly differently downstream in a BI tool. The same tools that empowered data teams also made it easy for people outside the team to start writing their own queries and building their own analyses, often applying different assumptions and filtering from the data analyst whose deep domain context had informed the original metric definition.
Metric definitions began to drift and diverge across tools and interfaces, eroding trust in data and pulling analysts away from more important work to answer questions like, why does my dashboard say revenue is $n but their dashboard says revenue is $n+1? Everyone was looking for the missing piece of the modern data stack. As Benn Stancil put it:
Today's current stack makes it easy to answer question[s], but really hard to answer [them] consistently. The core problem is that there's no central repository for defining a metric. Without that, metric formulas are scattered across tools, buried in hidden dashboards, and recreated, rewritten, and reused with no oversight or guidance.
The proposed solution was a dedicated layer within the stack, responsible for defining each metric once, compiling the resultant SQL, and making pre-derived metric values available to all through a single end-point. The metrics layer solution was compelling, in part, because it was proven. In a well-circulated blog, Airbnb detailed Minerva, a unified metrics catalog that routed a host of downstream data consumers through a single API for all canonical measurements across 12,000+ metrics and 200+ producers.
Despite initial momentum and investment in similar technology, like dbt's acquisition of Transform, no consensus playbook for implementing a metrics layer ever broke through. Eventually, the conversation moved on — pulled, like everything else in the industry, towards the newer, more exciting trends and technology.
Fast forward five years to 2026, and the center of gravity in analytics – as it is everywhere else – is AI enablement. The primary focus of data teams has shifted away from defining a bounded, single source of truth for metrics, towards a much broader goal: enabling everyone in the organization to receive on-demand data-driven answers to any conceivable business question.
AI interfaces remove friction, including the useful kind
Data teams – especially those with rich metadata, a clean mart or gold layer, and wide semantic modeling coverage – now see far fewer "ticket-oriented" questions because of AI. Through a tool like Hex Threads, a CX leader, for example, can ask why ticket volume spiked last week and within minutes get a series of charts and numbers describing related metric trends and segment contributors.
The ability for non-data team members to quickly and autonomously convert modeled data into analysis is largely an improvement for all parties. Most data teams do not want to be the only path between the business and the database and most stakeholders do not want every follow-up question to become a ticket. But some of the friction these tools remove is doing important organizational work. Healthy friction will slow down questions long enough to surface whether the right metric is chosen for the job, if its logic has been agreed on, and whether the right people are aligned around it.
Most chat interfaces will drive forward on a linear path to answer a question, and then the next, and then the next. That continuity has two problems in analytical workflows:
- A determined user can keep asking questions until they get an answer that sounds or looks like what they already believed. The answer is dressed up in queries and charts and maybe even a narrative, giving it surface-level legitimacy to the author and those who the author presented it to.
- Answer quality will degrade as a conversation lengthens and context becomes saturated. The analysis at question 15 is drawing on a much noisier context window than the analysis at question one.
Despite these shortcomings, the interface is not designed to enforce the same type of breakpoint that a human analyst might respond with under normal conditions, such as:
We have been circling this question for a while. Before we keep going, I'd like to bring Product, Finance, and Data into the same conversation and agree on what the right metric is for us to be anchoring to based on your strategic goal.
Maybe analytics agents will eventually get better at showing restraint, but today, the priority that drives widespread adoption is velocity. While agents allow users to accomplish lists of tasks quickly, they are less reliable when navigating more ambiguous, strategic goals and questions that require us to pause on producing more numbers and instead hone in on what we're actually trying to measure, and why.
The value of building consensus around metric definitions and logic increases as AI outputs are used in decision making. An incorrect answer is one thing when it lives in an exploratory notebook. It carries significantly more risk when it is presented to a board, drives marketing spend allocation, is justification for the launch of a new product feature, or is surfaced in a customer-facing dashboard.
We can easily imagine a scenario where two product managers on the same platform pull active user metric trends to inform their roadmaps. One PM's agent interprets the count of active users as any account with logged events in the last 30 days; the other filters to paid subscribers who completed a core workflow. Looking at what each believes is the same chart, the first PM sees casual users dropping off and concludes the product is too hard. The second sees power users hitting a ceiling and concludes the product is too shallow.
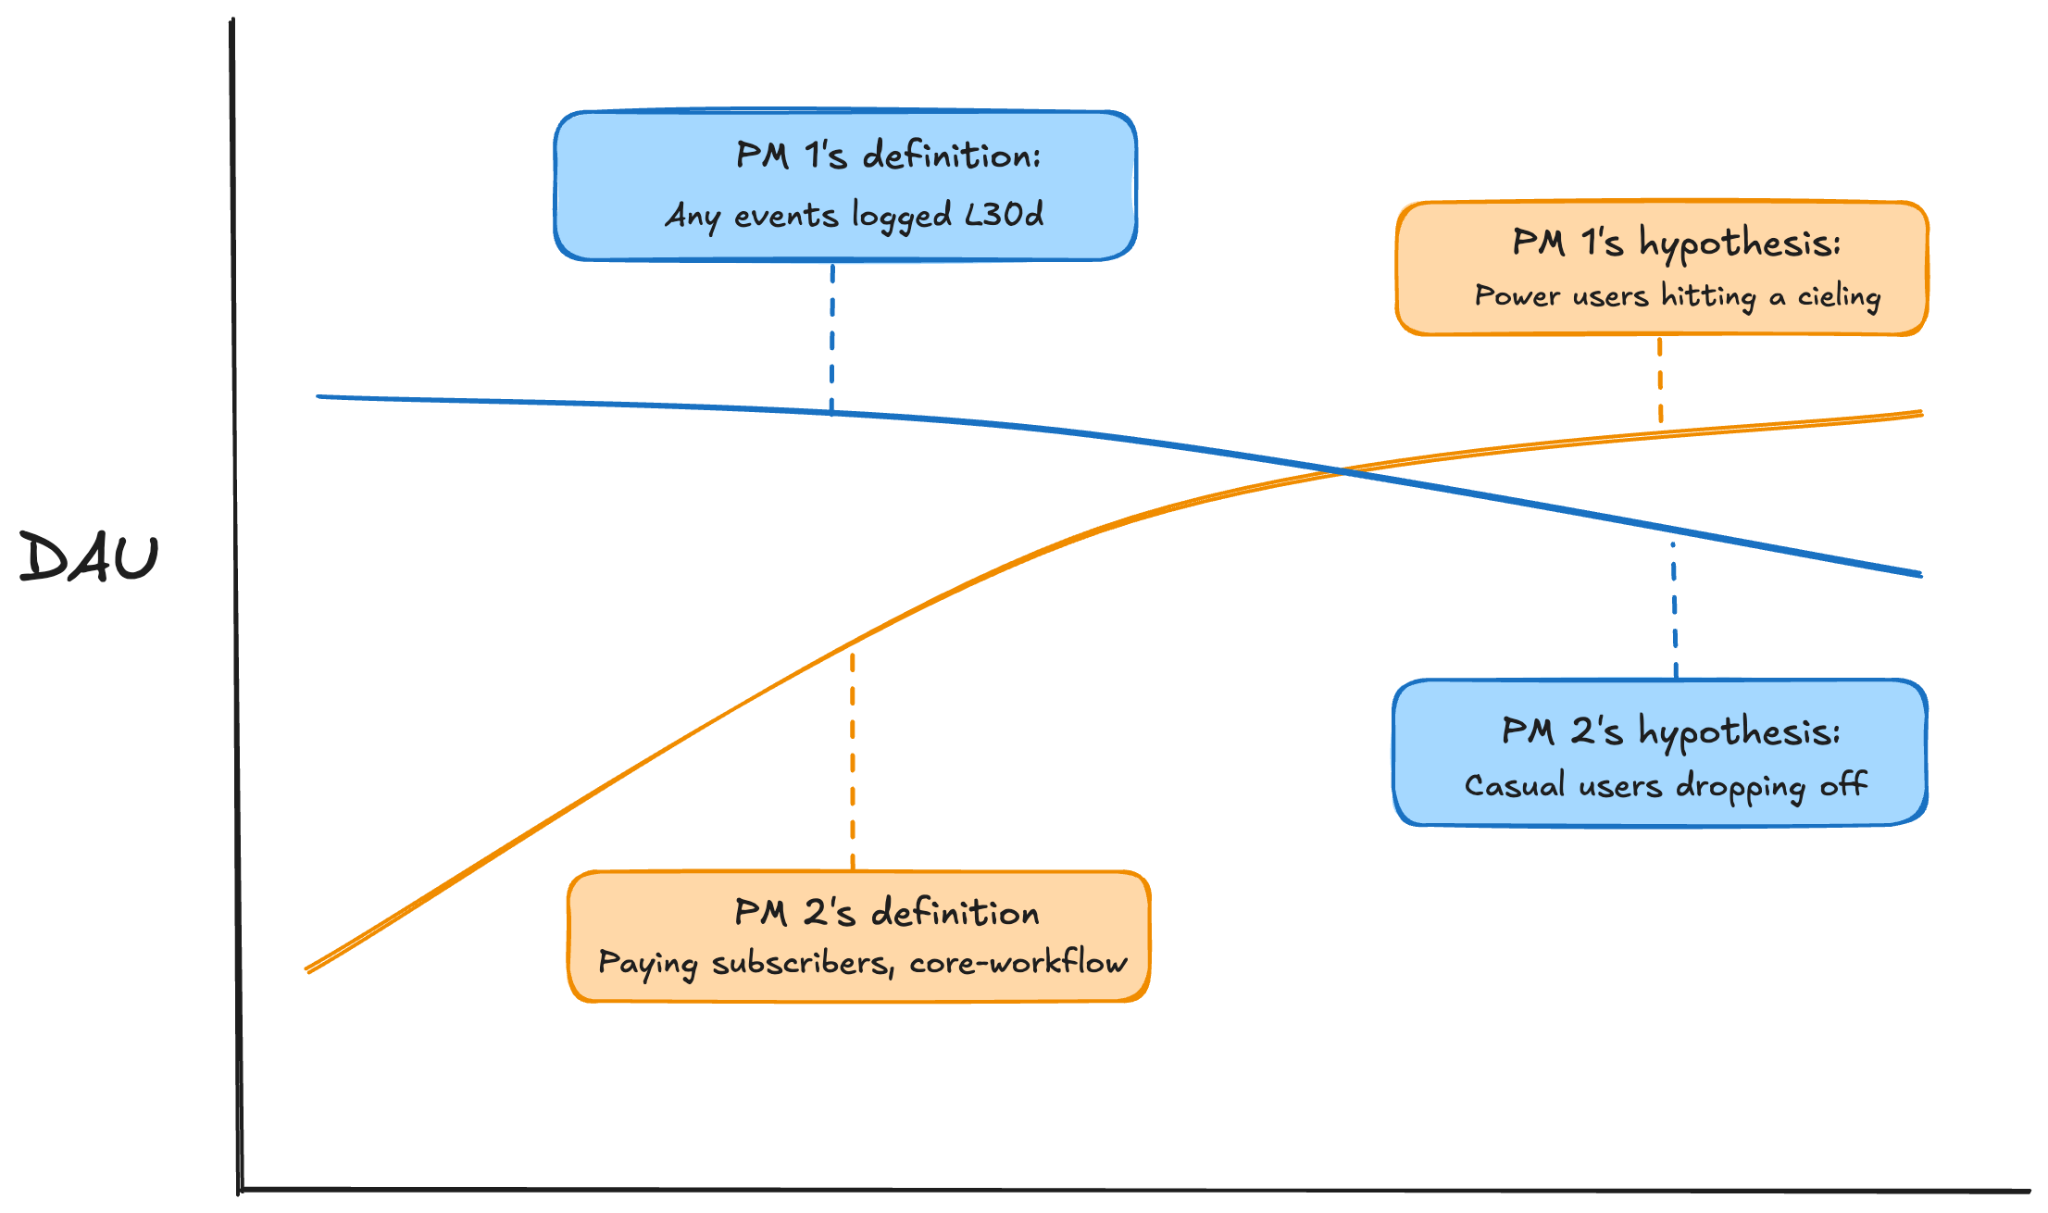
Same word, same chart, two different definitions — and two opposite product hypotheses.
The first PM ships a stripped-down onboarding experience; the second ships advanced functionality. The product now pulls in two directions at once, and by the quarterly review, no one can explain why activation is up but retention is down.
Divergence of truth is the same problem metrics layers were trying to solve, but the problem has an even larger surface area and velocity in the era of AI. More people can ask questions. More questions get asked. More answers get generated. Fewer answers pass through a shared analytical review process. More plausible interpretations can move through the business before anyone has agreed on which one is right.
The dangerous version of AI analytics is not obviously bad analysis; it is analysis that looks good enough to act on – and gets acted on – before anyone aligns on whether the underlying definitions were ever right.
What metrics layers are actually doing
The metrics layer is, no doubt, a technical solution – it is code that ensures "Total Revenue" gets calculated the same way, every time, for all users, across all data interfaces. However, the more significant value it creates is outside of the codebase. To create a metric, someone has to sit down with other humans who are also accountable to the answer and decide what revenue actually means – who owns the definition, on what grain it can be reported, what filters are applied, which segments it can be broken down by, how and when it is allowed to change.
It's worth noting how metrics layers differ from semantic layers. Semantic layer tools like LookML are great for supporting the broad, flexible exploration of data. They map business language and concepts to technical objects in the data warehouse, encoding terminology, metadata, and relationships that make data accessible. Many teams already rely on them as context and guardrails for AI interfaces. But accessibility is not the same as governance. A metrics layer is even more narrow and precise by comparison: it treats each metric as a version-controlled, ownership-assigned artifact with a formal change path, so that "Revenue" isn't just sum(price_usd), but rather an auditable source-of-truth number for any given point in time.
Think about how many foundational business questions require nuanced answers. What counts as a "user"? Does churn happen when a subscription ends, when a customer stops paying, or when an account is marked inactive? Is conversion measured from signup, activation, first payment, or first meaningful use? These aren't technical questions — they're business decisions that need to be answered before they're encoded in SQL.
Before AI interfaces, a lot of that ambiguity needed to pass through analysts for clear and standard definitions. A stakeholder would ask what sounded like a simple question, and the analyst would respond with a series of clarifying questions to ensure the technical SQL definition accurately captured the inferred business intent: When you say, "DAU", are you talking about users, profiles, or devices? Should $GMV be realized at time of booking or date of service? Is anyone else also reporting this metric?
That back-and-forth could be frustrating, but that friction was doing real work. It created confidence in the data and the decisions being made with it.
Good analysts slow down ideas that have high kinetic energy and poor direction to prevent teams from over-rotating around them. They notice when three people are using the same word to mean different things, forcing assumptions into the open and moving the business towards consensus of understanding.
Deterministic and probabilistic analytics
A metrics layer is bounded and deterministic. Each metric has a single name, SQL definition, and allowable segments. In practice, this means if two people ask for the same metric value over the same period of time, they get the same answer.
An AI interface is probabilistic. It is flexible, conversational, and adaptive — it interprets messy language, summarizes patterns, and helps users explore questions that were not anticipated ahead of time. Those same properties are what make it unreliable for questions where consistency matters.
Companies need deterministic, governed systems for those questions. Which metric drives sales team compensation? What versions of $ARR and DAU do we report to the board? A metrics layer is narrow by design; that constraint is what makes it trustworthy. That same constraint is what limits it as a resource for high-velocity, exploratory analysis. The moment someone asks a question that hasn't been formally aligned on, the deterministic system can't answer it directly — it can only offer what's already been agreed on as a starting point.
The role of human analysts is to decide which questions belong in which system. By defining the metrics that anchor compensation, board reporting, and other consequential decisions, they give the AI interface a deterministic foundation to defer to. Everything else — the long tail of questions that haven't been aligned on yet — is where the probabilistic system takes over.
Adding context and friction to your agent
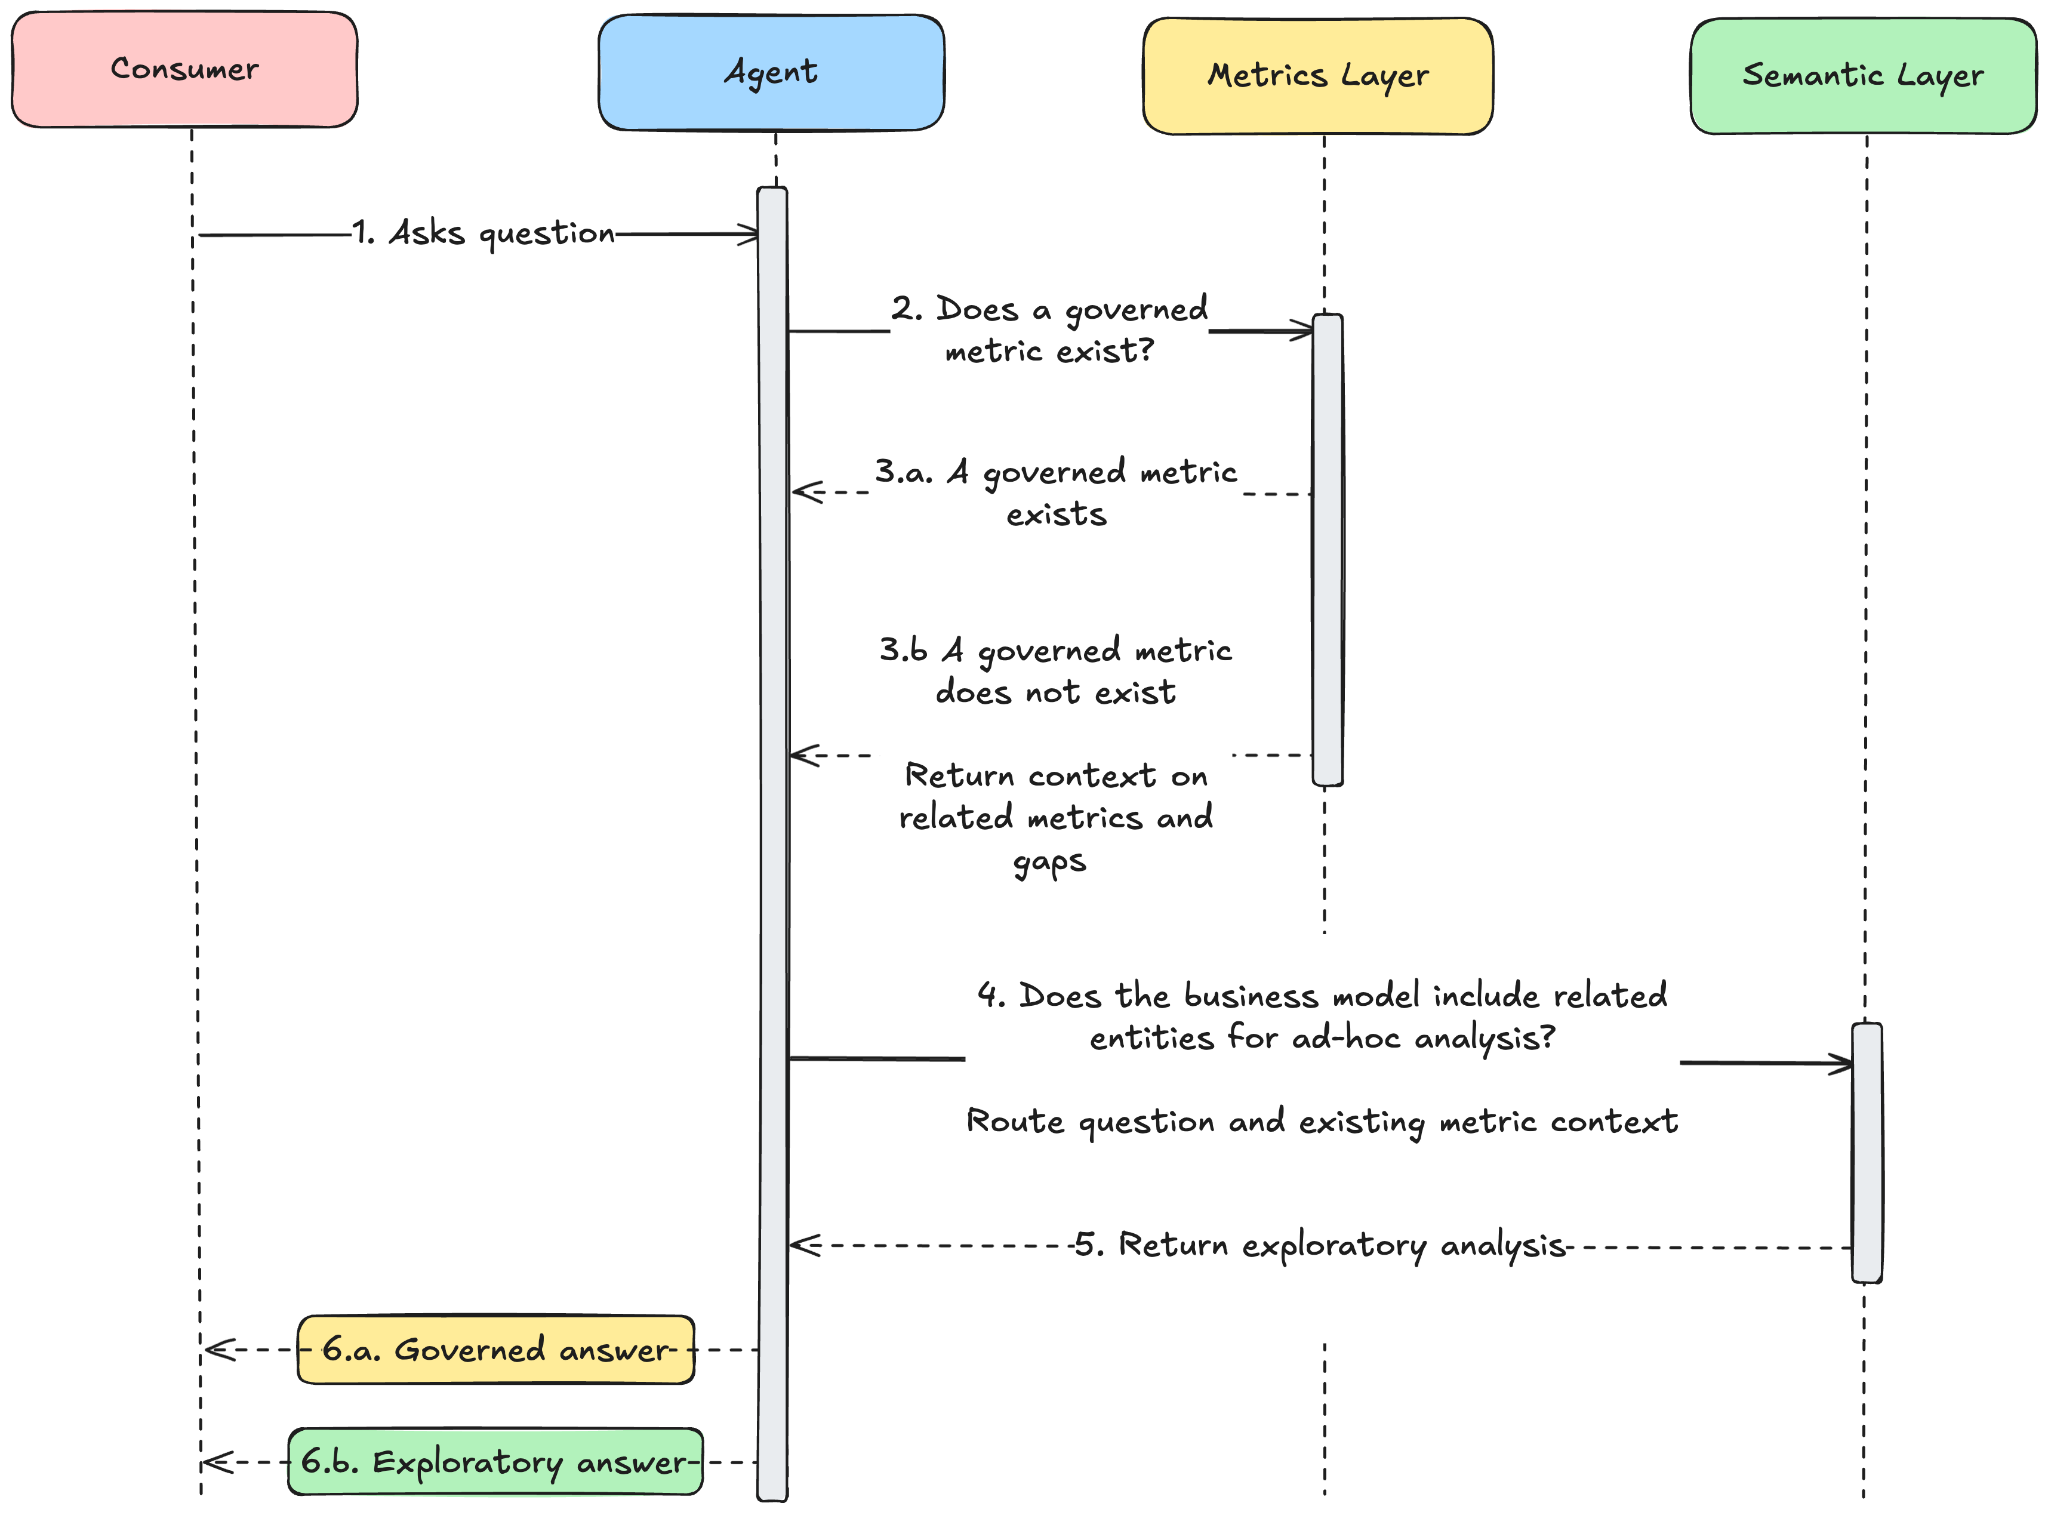
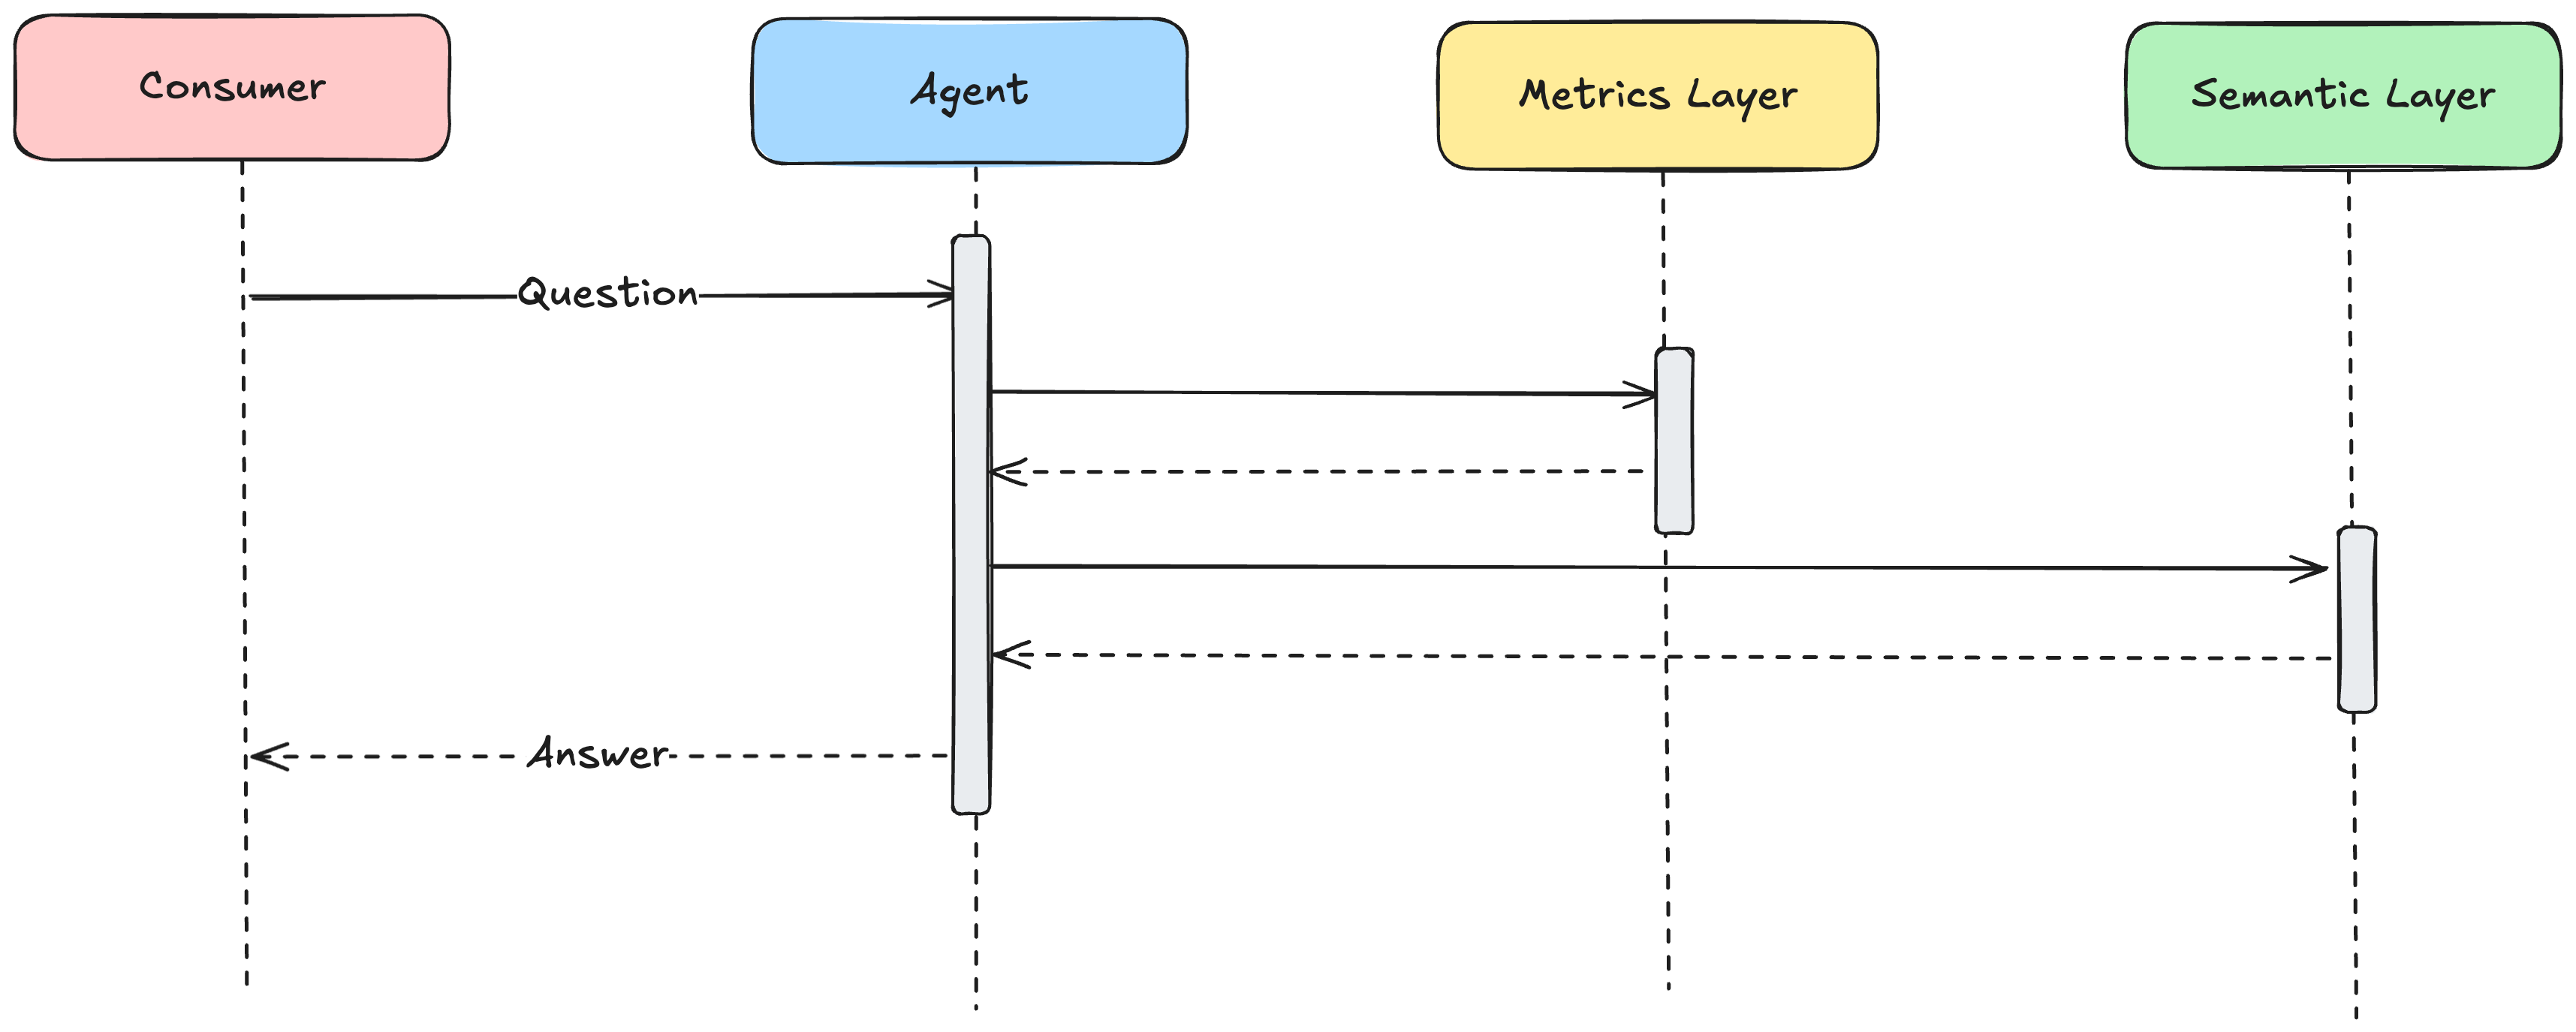
The agent checks the metrics layer first. A governed answer if one exists; an exploratory one if it doesn't.
The diagram above shows a simple decision: before generating anything, the agent checks whether a governed answer already exists. If DAU is a defined metric with an owner, a tested query, and pre-computed segments, the call returns it directly.
If the metric doesn't exist, or is only partially defined, the call still returns something useful — the boundaries of what has been agreed on, and where the gaps are. The agent carries that context to the semantic layer, which knows how the business is modeled and from that, it constructs an ad-hoc answer using a similar pattern.
The distinction between those two paths matters. One is a governed answer while the other is exploratory. A well-designed system makes that difference visible to the consumer — not just the number, but how much to trust it.
How metrics layers continue to evolve
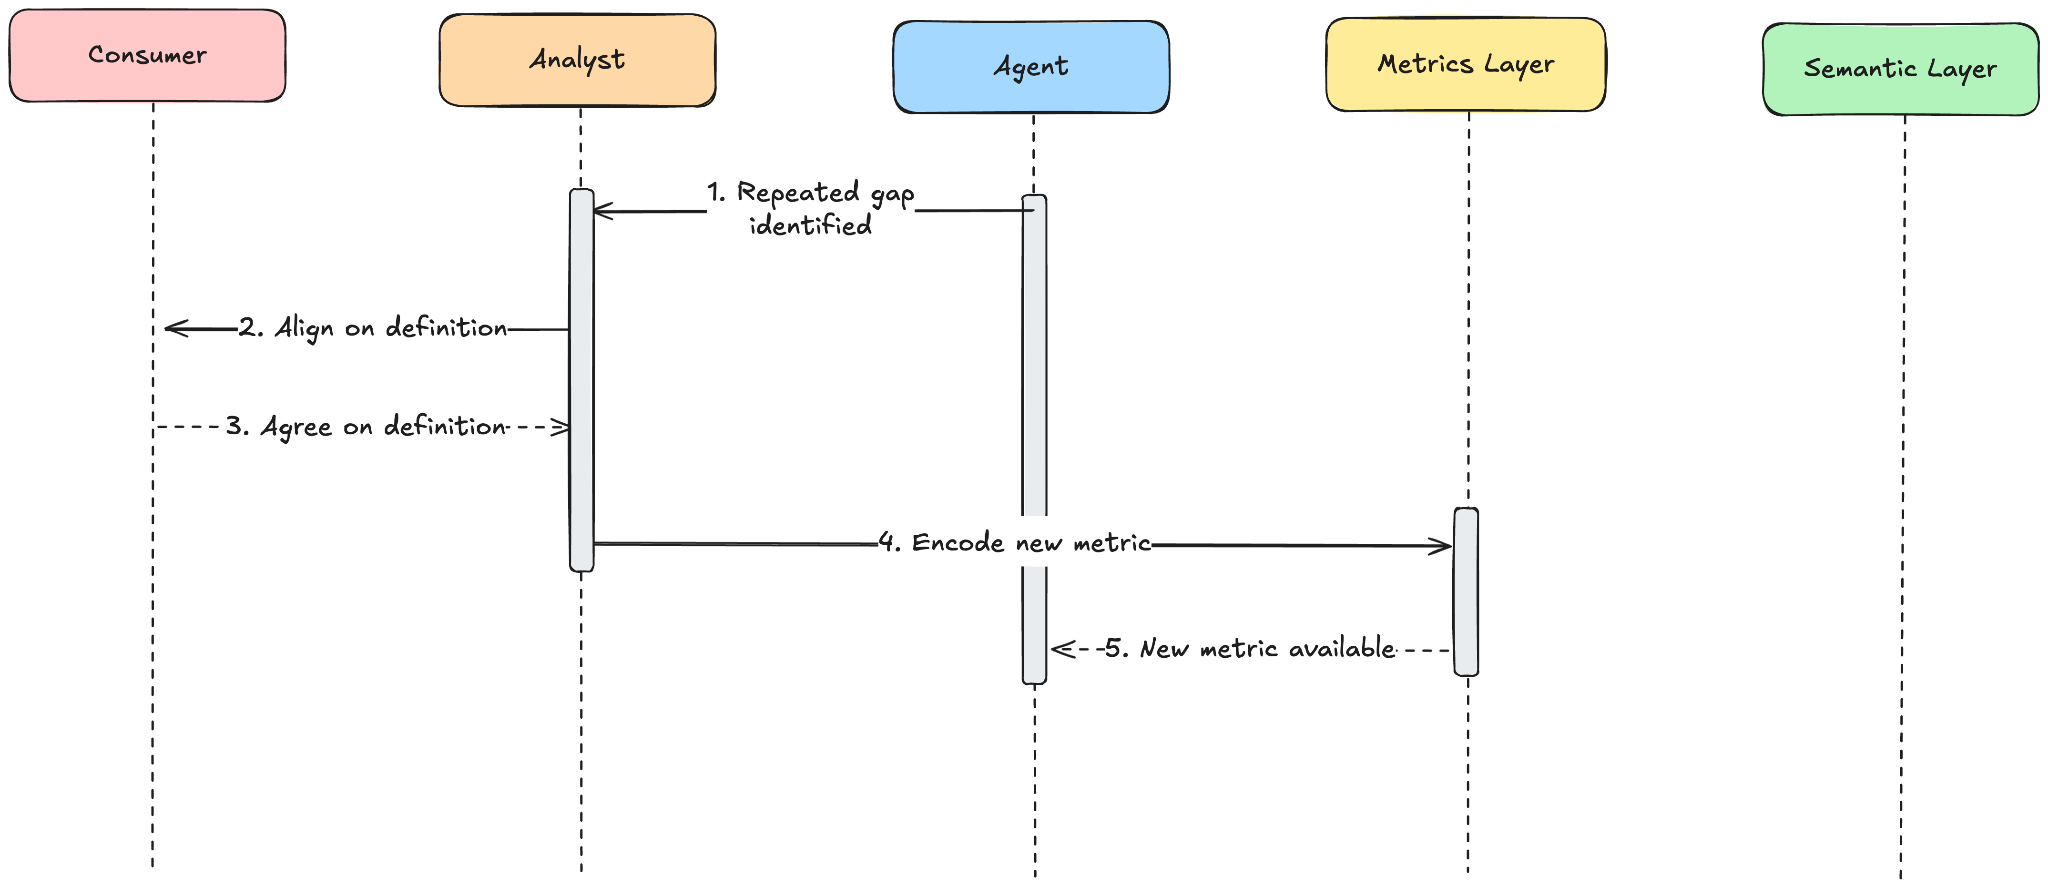
When a repeated gap surfaces, the analyst aligns with the consumer, encodes a new metric, and the agent has a governed answer to return next time.
Most questions should stay in the exploratory layer; a healthy data platform leaves room for one-off analysis and messy, fast investigations.
But repetition is an important signal in the system. When the same question keeps surfacing across AI chats, Slack threads, notebooks, and stakeholder meetings, the organization is likely in need of something more durable and consistent.
At some point, an analyst notices the pattern – or better yet, is prompted by the agent who detects the pattern (Hex's Context Studio and Lightdash's Autopilot, for example, surface semantic gaps from conversation history and content). The analyst then does what analysts do best: they work with the relevant stakeholders to align on a definition that ensures the technical meaning of the measurement matches business expectations and utility. That definition gets encoded into the metrics layer and the next time the agent checks, a governed answer exists.
That is the feedback loop the system is designed to run: exploration reveals demand, repeated demand surfaces gaps, gaps prompt definition, and definition creates a metric the agent can serve directly next time.
What's next?
In a followup post, I'll go deeper on how to design, build and implement a successful metrics layer.