Build source-of-truth dashboards your execs will actually use
We help clients implement modern BI platforms and strong analytics foundations to enable trustworthy self-service analytics.
Most companies either build dashboards that nobody uses or create reporting bottlenecks where analysts are inundated with ad-hoc questions. We implement BI tooling that fits your organization's specific needs, and build company-level reporting that leverages your single-source-of-truth metric models.
See how we built performant, embedded customer-facing Looker dashboards.
Our Approach
Self-service analytics that teams trust
Paired with a strong transformation layer, we help clients implement modern BI and analytics platforms (like Omni, Looker, and Hex) that enable your team to build reporting independently with full trust in the underlying data.
- Dashboard Development
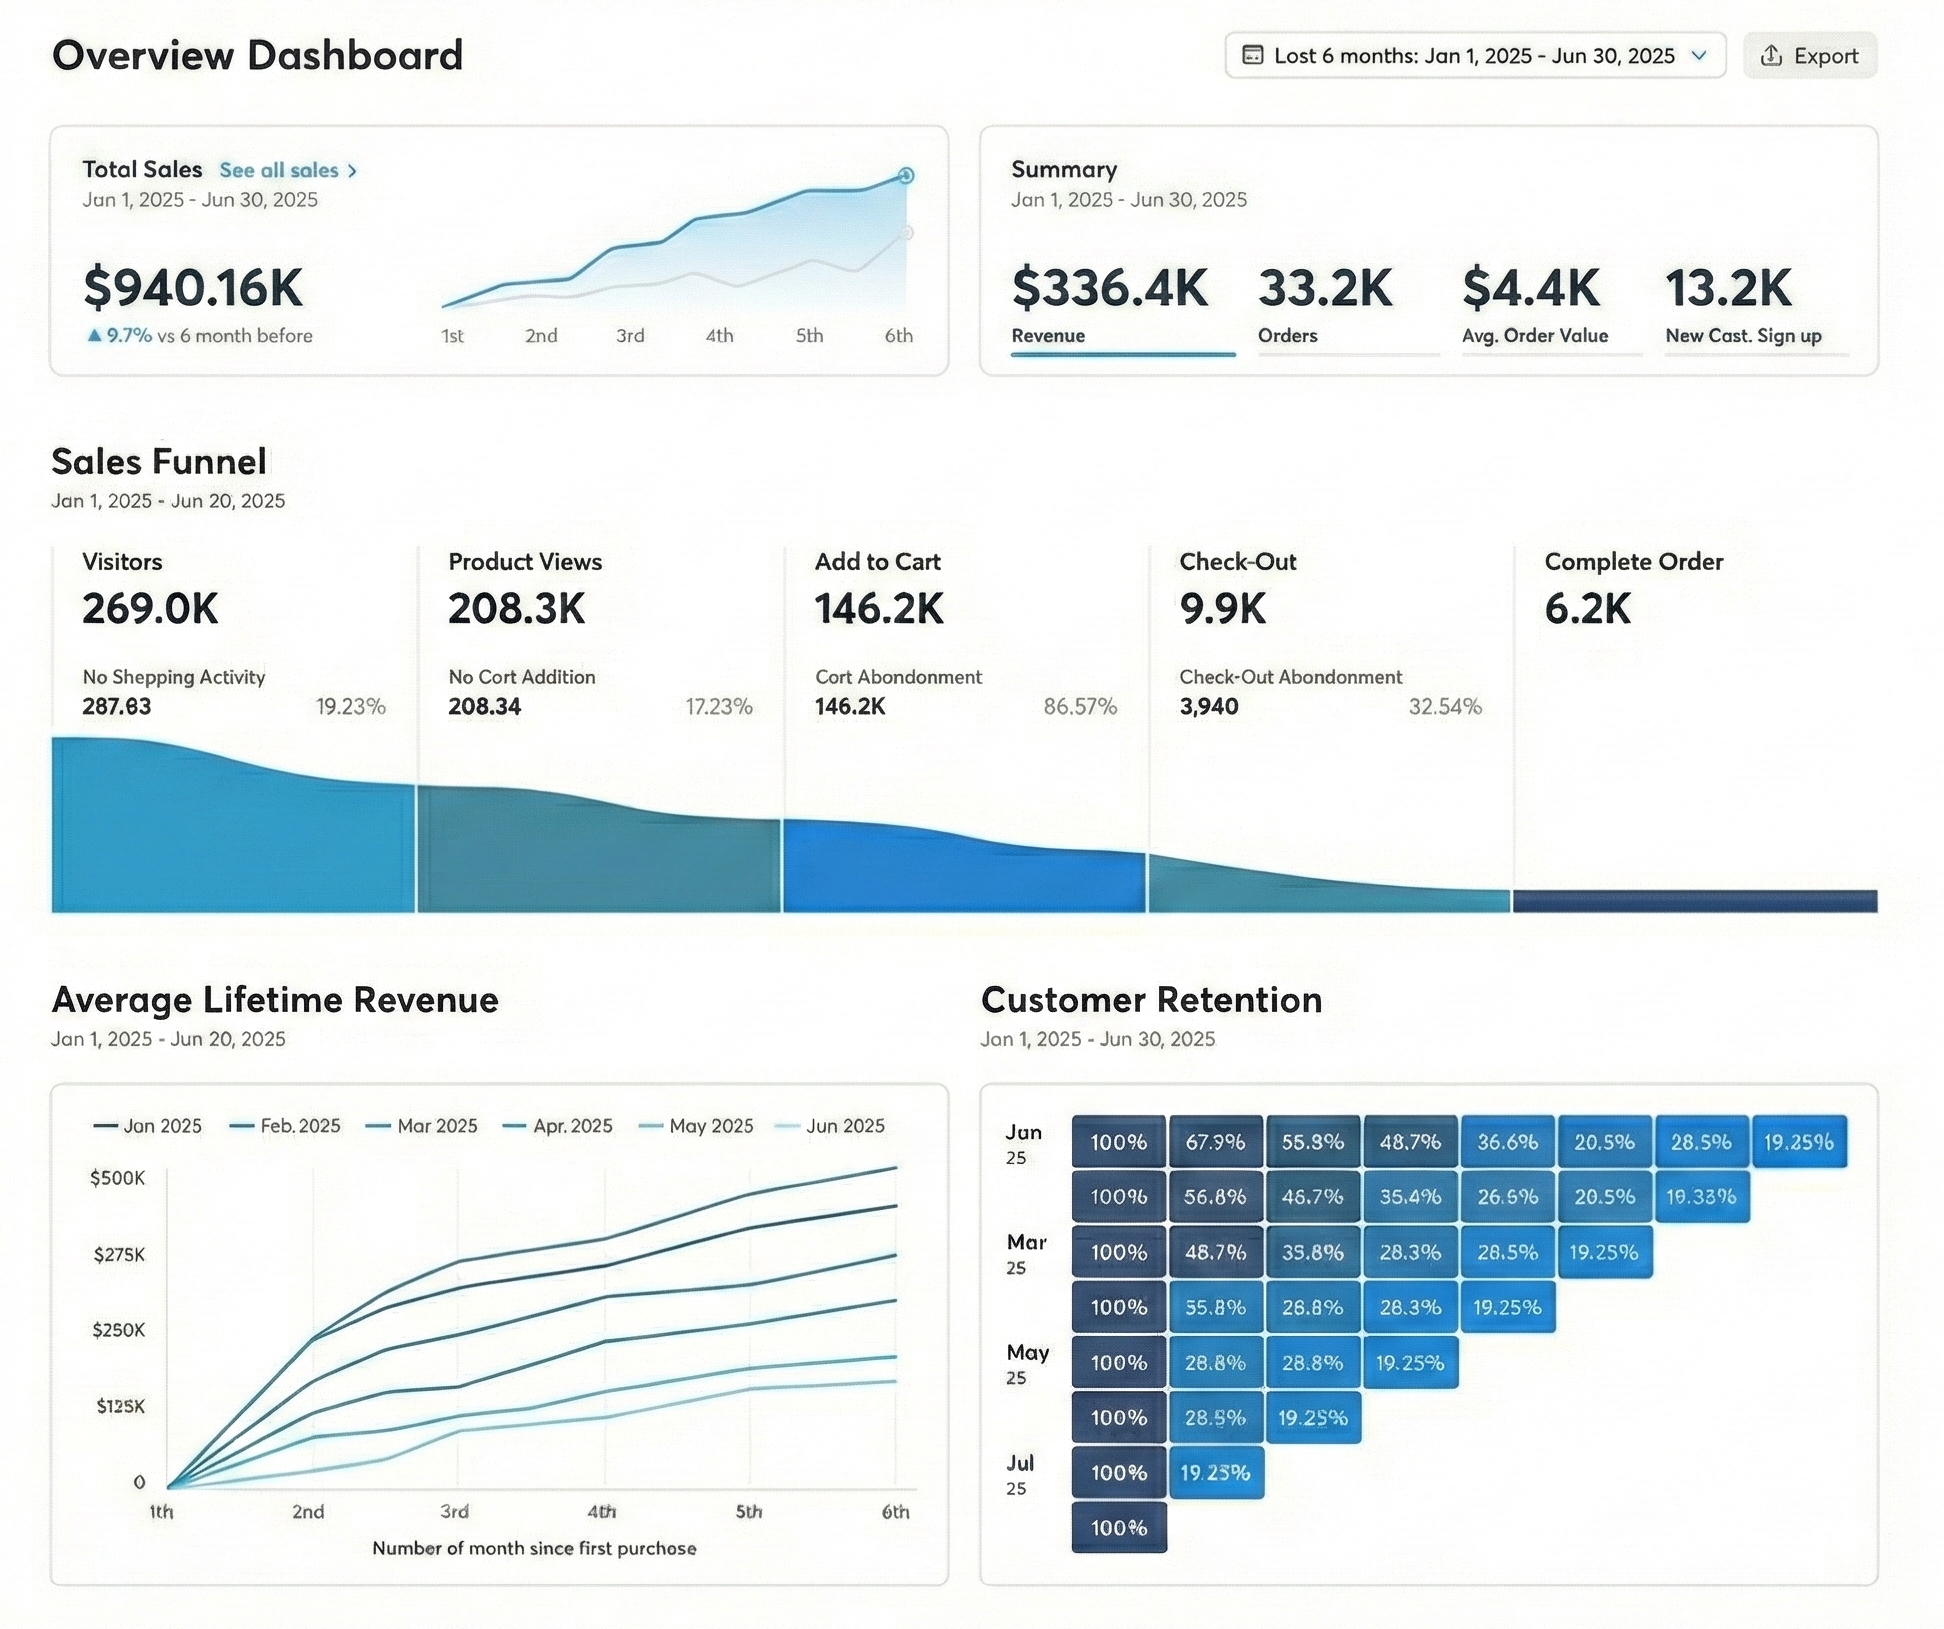
- Company-level dashboards that executives will actually use. We focus on metrics that inform decisions, not vanity KPIs.
- Access Controls & Security
- Row-level security and role-based access controls ensure users see only the data they should. Protect sensitive information while enabling self-service exploration.
- Embedded Analytics
- White-label dashboards integrated directly into your product or internal tools. Enable customers to access insights without leaving your application.
- Training & Enablement
- Training sessions and documentation so your team can confidently build their own views, manage dashboards, and explore data independently without direct Data team support.
Ideal For
Data-driven Organizations
Startups
Build investor-ready dashboards that track growth metrics and operational KPIs. Deploy BI platforms that scale from seed to Series B.
Engineering & Data Teams
Deploy self-service platforms that empower business users and product teams to answer their own questions. Reduce ad-hoc requests and free up engineering time.
Operations Teams
Actionable dashboards for monitoring efficiency metrics, workflows, and bottlenecks. Get real-time visibility into your business operations instead of waiting for weekly reports.
Ready to democratize your data?
Work with us to build a data-driven organization. We can help you build insightful, governed company-level reporting and trustworthy self-service analytics.