
Introduction
In early 2025, Snowpack partnered with one of our clients to work on an embedded dashboard project. This client works in the legal technology space, providing modern software for law firms to track and manage key information across their business. Like many modern technology businesses, their software was built out of necessity, with features shaped by feedback from their in-house legal team, who use the same platform that they provide to their customers.
The in-house team developed a set of dashboards over time to monitor key metrics that are not yet supported by the core product. The goal of this project was to take one of those essential dashboards and embed it directly into their client-facing platform, so that all law firms using their product could seamlessly track the same key metrics.
Our Snowpack team has deep experience in this particular kind of product development, so we were excited to help our client and learn more along the way!
Build vs Buy Consideration
One of the first decisions to make when scoping this type of project is a build vs buy decision for serving the analytical dashboard. We needed to weigh the tradeoff between a third-party embed of Looker (their existing BI tool) or building a custom BI interface into the product. Embedding a 3rd party BI tool such as Looker offers massive time savings and comes with some key benefits:
- A user interface to display the data doesn't need to be designed and built.
- Updates to the dashboard can be iterated quickly.
- The expectations of features like responsiveness and caching come "batteries included".
However, opting for a 3rd-party embed limits our ability to customize the experience, requires a continued commitment to Looker licenses, and doesn't flow through the existing code management process that serves the rest of the application.
Ultimately we chose Looker for the following reasoning:
- It allows us a faster iteration cycle, first of getting the analytics experience into the hands of users, and then to tailoring that experience based on their feedback.
- It keeps the experience identical to the internal legal team, so their feedback can quickly flow to clients.
- The client has a strong commitment to Looker and doesn't expect any switching requirements soon.
- It does not preclude the client from insourcing the analytics experience in the future.
Design
Delivering an analytics dashboard to a production system has much different constraints and consequences than those of an internal BI tool. The query load that we need to expect from this dashboard is expected to far surpass that of an internal dashboard, and the query latency needs to be low if we aim for users to actually use it in the application. Right now the data that powers the existing internal Looker dashboard is stored in BigQuery, an "infinitely" scalable OLAP database that we can expect to provide both high concurrency and reasonable latency, however it will come at a high cost relative to a traditional OLTP database and cost will scale linearly with usage. We will need to design around this as our key concern to ensure that we can efficiently deliver data to users and reduce the operational cost of this tool.
Snowpack has had experience implementing a number of embedded analytics systems now, and we've found that the key to serving both a consistent and performant user experience is using a Metrics Store. A metrics store at its most basic is a cache of metrics updated on a regular cadence to provide immediate access to pre-computed facts. It is a relatively simple data layer, but it can come in a lot of different forms, the one most people have probably interacted with is a "data-cube".
In the world of the "modern data stack" we could think of the metrics store as a bygone fossil from a less performant world, when metrics were pre-computed and stored for later retrieval due to limitations on compute and memory that we usually no longer have today. Most modern BI tools now rely on "calculation on the fly", leveraging the horizontally scalable nature of connected cloud data warehouses to scan massive amounts of data and compute values at request time. This performance can seem magical, but it is still not as performant as indexed row requests to an OLTP store, and the downside is that large computations can rack up massive warehouse bills if unmanaged.
The existing Looker dashboard relied on exactly the "calculation on the fly" behavior described above. Using a Looker Explore a web of tables was joined together to power each of the data requests to the dashboard, around 30 in all with an average process size of 3GB. BigQuery charges per byte processed, bringing the per-load cost of this dashboard to $0.51. While this doesn't seem like a lot, we need to expect that thousands of users could load this dashboard each day, multiple times a day, a cost that could get out of hand pretty quickly before we even considered the limitations on slot usage. The other aspect is time to load — the dashboard calculations are slow in the relative sense of what users expect a page load on an application to look like, the original dashboard with its on-the-fly behavior loads in an average of 11.8 seconds, a poor user experience for anyone clicking into this page.
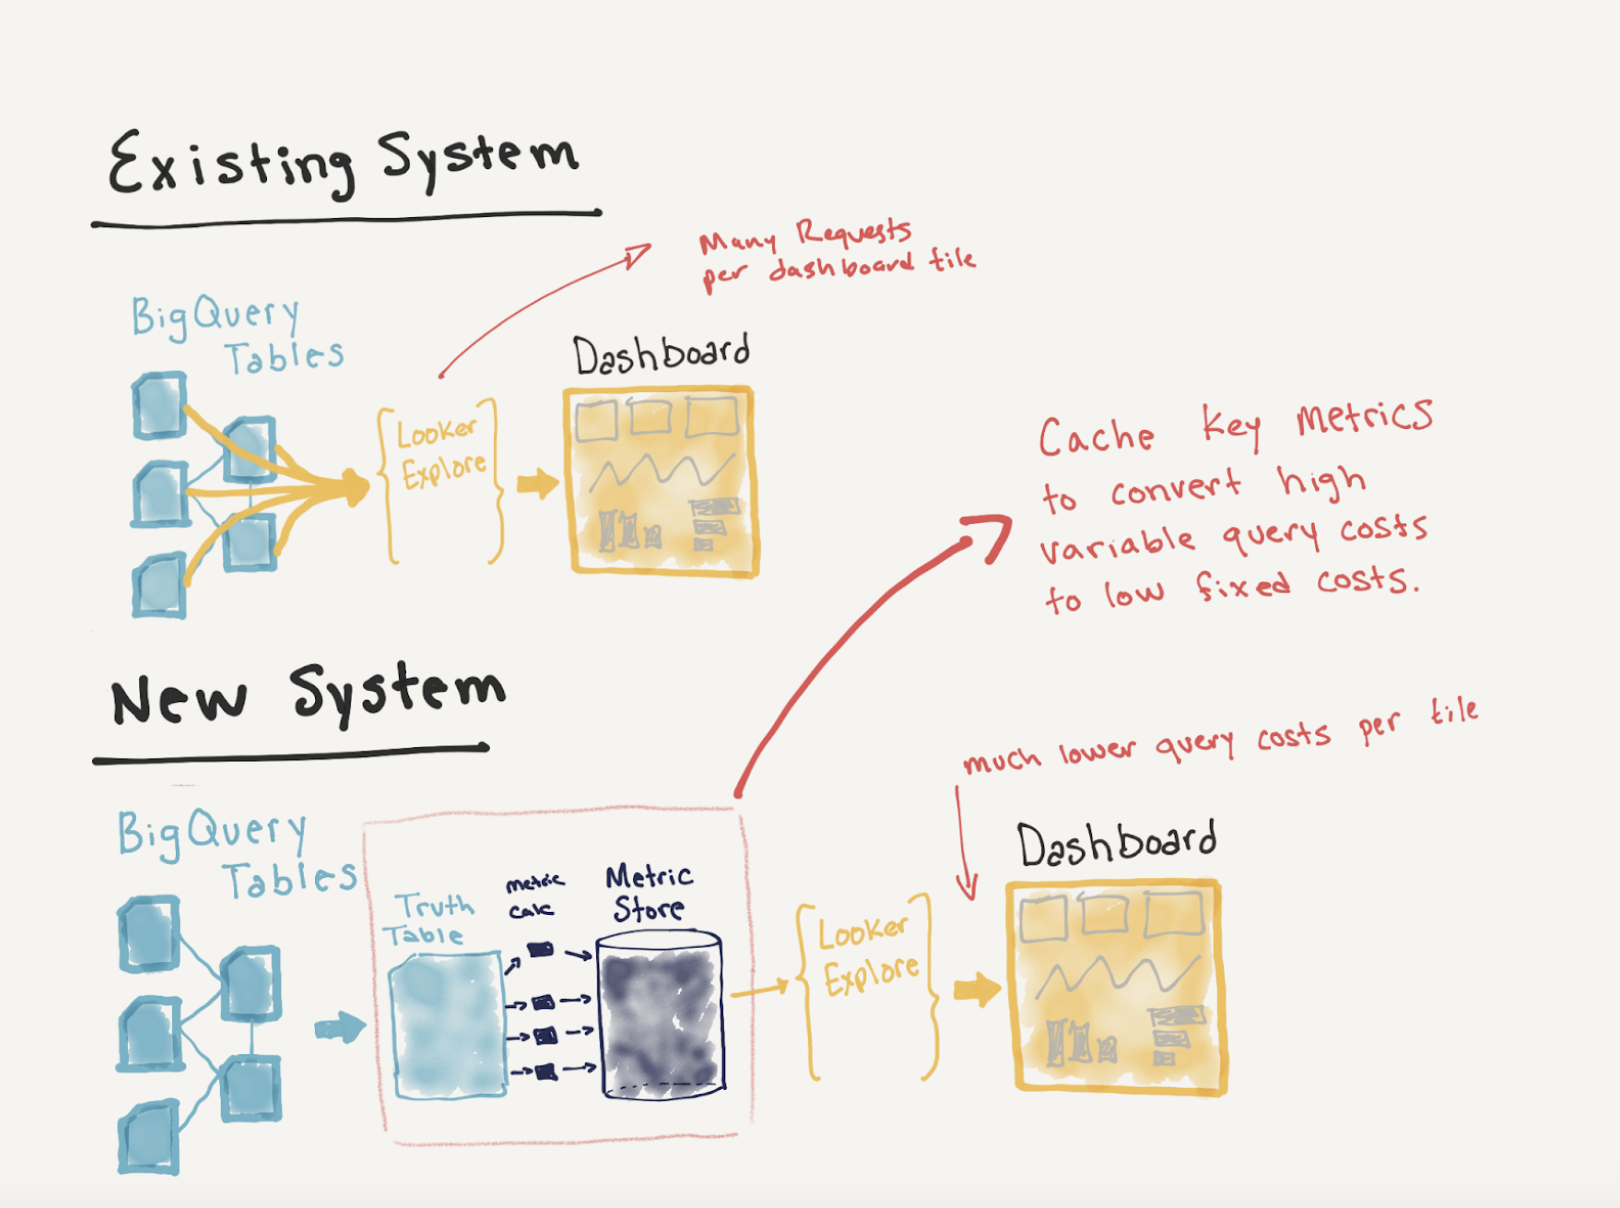
Diagram showing the metrics store architecture for optimized dashboard performance
With the challenges described above, the concept of the metrics store becomes a necessity. Our design would be to first materialize the necessary join of data as a truth table and then to precompute all of the necessary metrics for each firm on a set cadence and cache those for quick retrieval. Each of the dashboard tiles would then be a simple request for a metric, executing at effectively no cost, and loading with minimal latency. This pushes the most costly request - the join across many BigQuery tables - to a single scheduled query that can be managed as a fixed cost, and makes the variable component, the metric retrievals by customers, an extremely low cost (and low latency) query.
The additional benefit of the metrics store is that it does not limit us from making UI changes to the analytics experience. Any BI tool or self managed analytics interface will be able to read from a metrics store as an API to display values on the page, which gives us the flexibility in the future to easily migrate to a different embedded BI tool, or build our own custom UI.
Metrics Store Development
The metrics store we aimed to build for this project is a lightweight version of this solution. It accomplishes the requirements of building an hourly store of metrics and caching them in a standardized schema, but doesn't introduce additional complexities into the existing data-engineering system. This however does not limit the effectiveness of what a datastore can do for this project. The first step we took was to take the existing network of queries that were joined together to generate the current Looker Explore and turn them into a more lightweight optimized table running on a BigQuery schedule. By computing this data as a static table with only the required information we are able to reduce the query overhead of each of the individual metric calculations and only do the single "heavy" compute once per hour, a cost that we can manage way more effectively.
The Metrics are then calculated as templated queries to the staging table that each have an identical schema. Each metric has a Name, Description, Metric Time, Time Dimension, Metric Dimension and Value. For example this means we can calculate "Active Users, for Jan, 2025 for Firm 123" and store a value. When we serve the dashboard, we issue an OLTP style query to the database to retrieve only the most recent calculated version of that metric. Each of these queries returns almost instantly and our requirements for calculation are very limited.
One of the benefits of a metrics store is the ability to "rewind time" to review metrics. Since each metric is calculated contemporaneously, if we ever need to audit values, or review the historical trends of how metrics change over time we can easily look through the history of these metric calculations to see how values have changed.
Embedding Looker
The next step to the project is embedding Looker into the product. Looker has a number of different options for doing this. We're going to avoid going into the gritty engineering details but rather talk through some of the challenges and details of meeting the requirements of:
- (1) Embedding a specific dashboard
- (2) Limiting data access by user
- (3) Ensuring a seamless UI experience
The first requirement is that we needed to rebuild the Looker dashboard that is currently in use and tailor it specifically to support the embed. To do this we created a new Explore built on top of our metrics store — so now each "tile" is just a request for a metric value from the metric store rather than the on-the-fly calculation across a web of tables.
The second requirement is limiting data access by user. We don't want firms seeing analytics for other firms, or metrics that are blended across multiple firms. To do this we included an access_filter at the explore level. This is a feature in Looker that enforces a filter at the query generation level for every single request based on a Looker user's attributes. By setting the UserID for each user, we can ensure that the data they access is limited to ONLY data that they are eligible to see at the query generation step. This runs hand in hand with our metrics store design which includes a unique client id as a required dimension for each metric so that we can use it to filter rows.
The final goal is to keep the dashboard itself a seamless part of the product, and so to do this we used a signed embed to serve an iframe of the dashboard in the web app. Each time a user logs into the online experience, we first authenticate the user, then generate a request to Looker to generate a signed URL unique to this user session and embed it on the web page using an iframe. This URL includes information about the client, which automatically filters and limits their access to the underlying data in the Looker Explore. This ensures that they only see metrics for their specific account. If the user is not successfully authenticated or their account is not successfully identified, their request for a signed URL will return a 403 and they will get a graceful error instead of a broken dashboard.
Wrapping It All Up
This type of project is a very typical problem for data driven businesses and we've seen many different implementations as businesses find ways to quickly share valuable data with their customers. The challenges largely fall into the two buckets we discussed in this article
- (1) how can you serve the analytics efficiently
- (2) how can you display them seamlessly.
We find focusing on fundamental analytics and establishing a strong metrics layer, and in this case a metric store to cache key values, is one of the most successful design concepts. The beauty of this type of solution is that it does not close any doors in the future. If we feel the need to build a custom dashboard in the application we can easily use the metrics store to serve the required information and change how that data is handled in the front-end display. Similarly if they want to add new metrics to the dashboard we simply need to register the calculation for that metric in the metric store and it will become available for use in the dashboard.
Ultimately the metrics store also provided major improvements over a naive Looker embed. The expected cost per dashboard load is $0.002, down from $0.51, a 255x decrease in cost! The load speed is also much faster with a full load taking on average 5.2 seconds, an over 50% decrease from the initial dashboard load time of 11.8 seconds. Choosing how you decide to serve the analytics experience is a very customer-to-customer decision and valid options vary wildly. In this case embedding Looker made a lot of sense, and the included features saved a significant amount of development time over manually creating a UI.