Dagster and dbt: A Perfect Match
A powerful combo for orchestrating your data worfklows
Danny Blumenthal | June 11, 2024Introduction
As part of a project I recently worked on, we implemented an ETL pipeline that leveraged Dagster to orchestrate dbt Core. Check out the other blog post here! I've worked with other orchestration tools in the past and seen dbt Core deployed/orchestrated in multiple different ways, but this was my first experience with Dagster. If you know me very well, you know that I'm a pretty reluctant content-creator, but I felt compelled to write a blog post here because I was so impressed with how well the two tools complement each other.
First off: what does each one do?
dbt
dbt (data build tool) is an open-source tool that manages the transformation layer of the ELT process, allowing users to define transformations using simple SQL statements and eliminating the need for DML and DDL statements to build/maintain tables. dbt allows you to manage and version-control your business logic as code, and enables teams to define a single source of truth for metrics, insights, and business definitions. It also infers and manages table lineage & dependencies to generate a DAG for all of your analytics models.
Dagster
Dagster is an open-source orchestration tool that enables users to build, schedule, and execute data pipelines. It can easily integrate with the tools in your data stack, and can be used to orchestrate the entire ELT lifecycle (from ingestion to transformation to reverse ETL). As I'll touch on later, it also provides an intuitive UI for end-users to view data lineage, monitor the freshness of tables and their upstream sources, and kick off ad-hoc dbt runs.
What makes Dagster different
Most traditional orchestrators are task-centric, meaning they focus on executing a sequence of tasks (ex: pull data from an API, apply some transformations, create a new table in the data warehouse). A task-centric approach focuses more on the "hows" than the "whats" (e.g. pulling data from an API would represent a task)
Dagster on the other hand, uses an asset-centric approach, meaning that it focuses more on the outputs of each step in the workflow. An asset-centric approach focuses more on the "whats" than the "hows" (e.g. the table created to store the output of API query would represent an asset).
Why they naturally fit so well
Dagster and dbt both focus on the concept of data assets and how they relate to one another. In Dagster, an asset is a piece of data that is produced within a pipeline (e.g. a table or a file). In this context, each dbt model would represent an asset definition in Dagster. Both tools view your data project as a series of interrelated assets that are directionally linked.
In general, structuring your data assets as a DAG helps simplify the management of dependencies, understand data lineage, and debug problems in your data pipeline. Given the shared mental model between the two tools, Dagster's dbt integration understands your dbt models as data assets, infers the relationships between them, and provides a clear picture of your data lineage. It also provides an easy view to see where your data is coming from and what transformations and tests are being applied at each step.
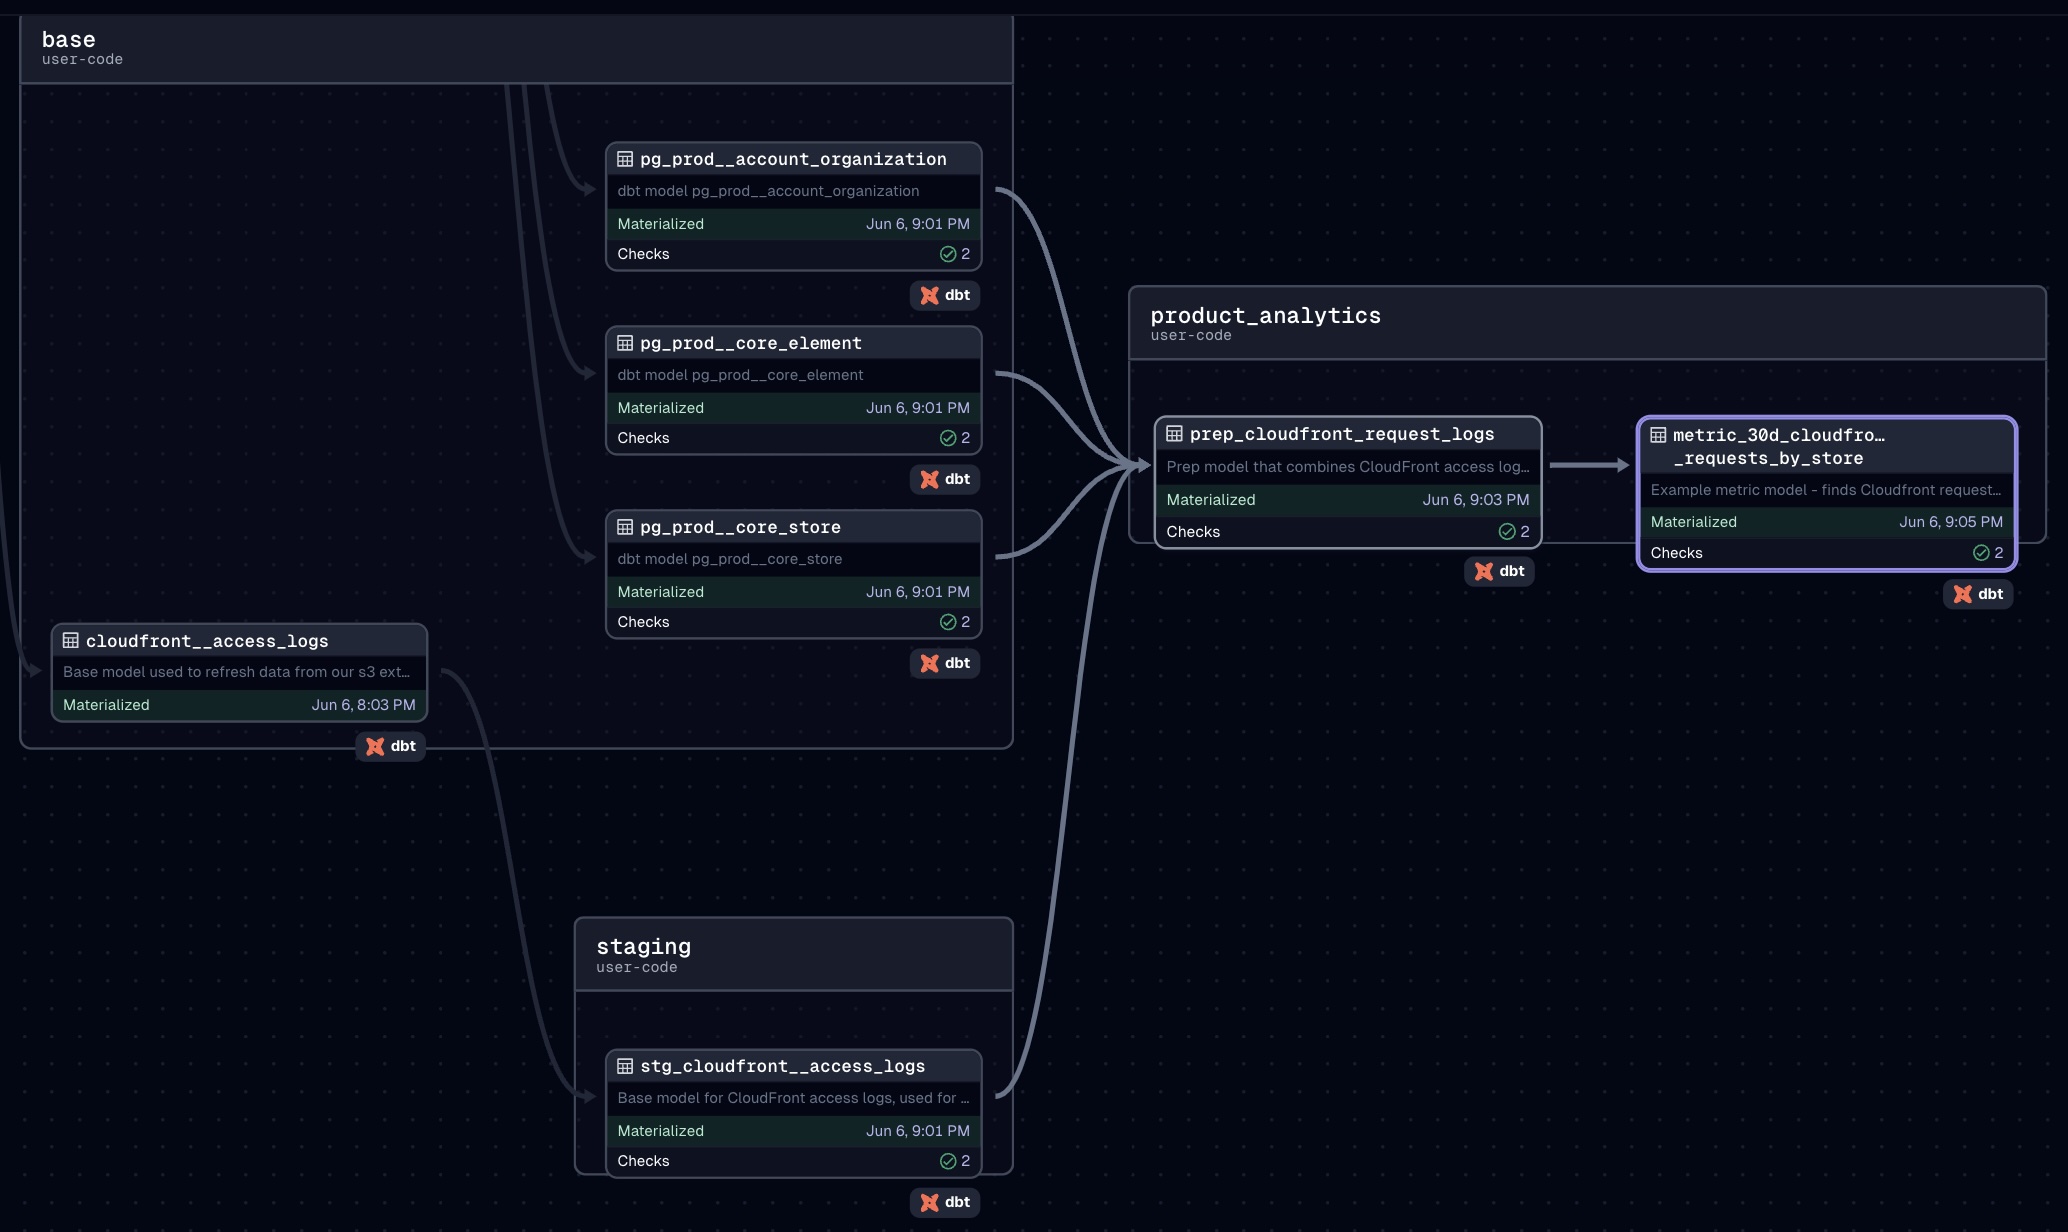
In the screenshots below, you'll see 1. the classic dbt lineage graph from dbt docs, and 2. how this is represented and automatically inferred by Dagster when you import your project:
dbt:

Dagster:
Powerful UI for End Users
Aside from the ease-of-setup to import your dbt project, the UI of the Dagster web server is really the killer feature that sold me. From the various orchestration tools I've seen, Dagster shines in its ability to give you all of the information and functionality you would want in order to interact with your dbt project on a deep level.
Inspecting Table Lineage
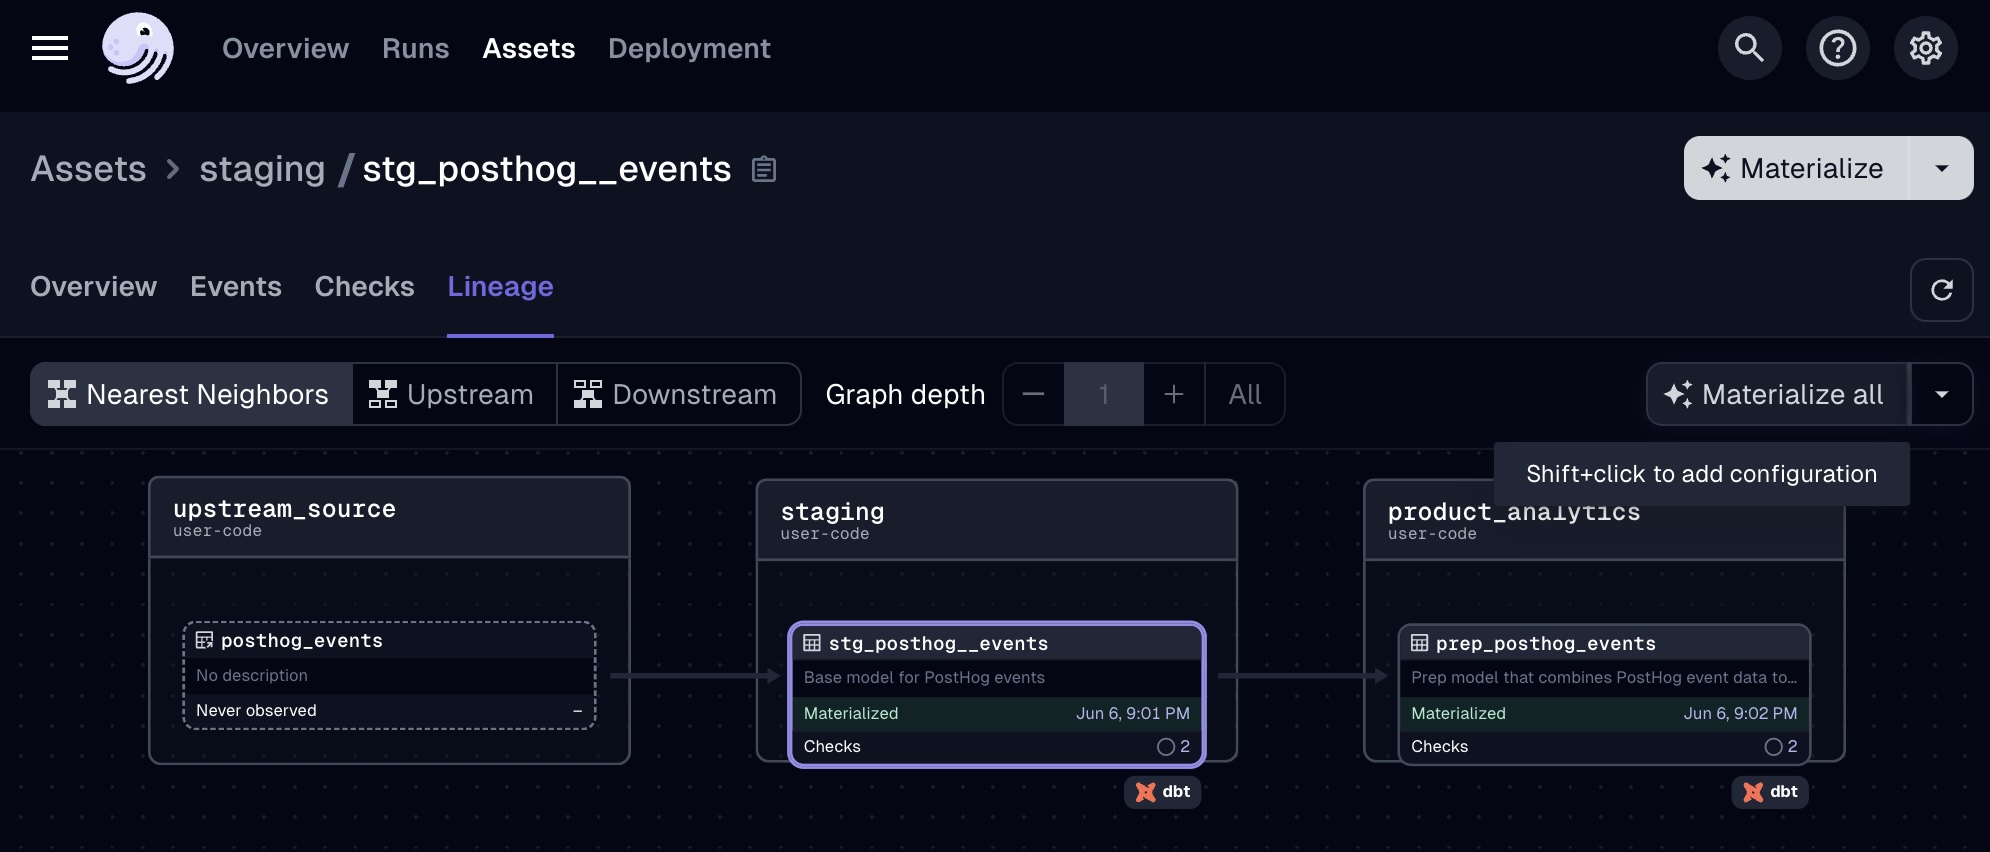
As touched on above, the Asset Lineage view gives you the ability to select a particular dbt model, and view all of its upstream/downstream models (just as you would with dbt docs). You can also use this lineage view to selectively kick off ad-hoc dbt runs of a specific model plus its related upstream/downstream models.
If you make an update to a model's logic or if you know that something has changed in an upstream table, Dagster provides you with much more flexibility for rebuilding your tables than you would typically have while using other orchestrators. With a traditional task-centric orchestration approach, you would typically either need to wait until the next scheduled job runs to rebuild your models, or you could manually kick off the task – either way would likely involve running your entire dbt project (rather than just the 2-3 models of interest) as a task.
On the other hand, Dagster's asset-centric approach emphasizes individual assets and their relationships to one another, providing you with the flexibility to selectively kick off ad-hoc runs of specific dbt models as well as their related upstream & downstream models:
Viewing Model Code & Descriptions
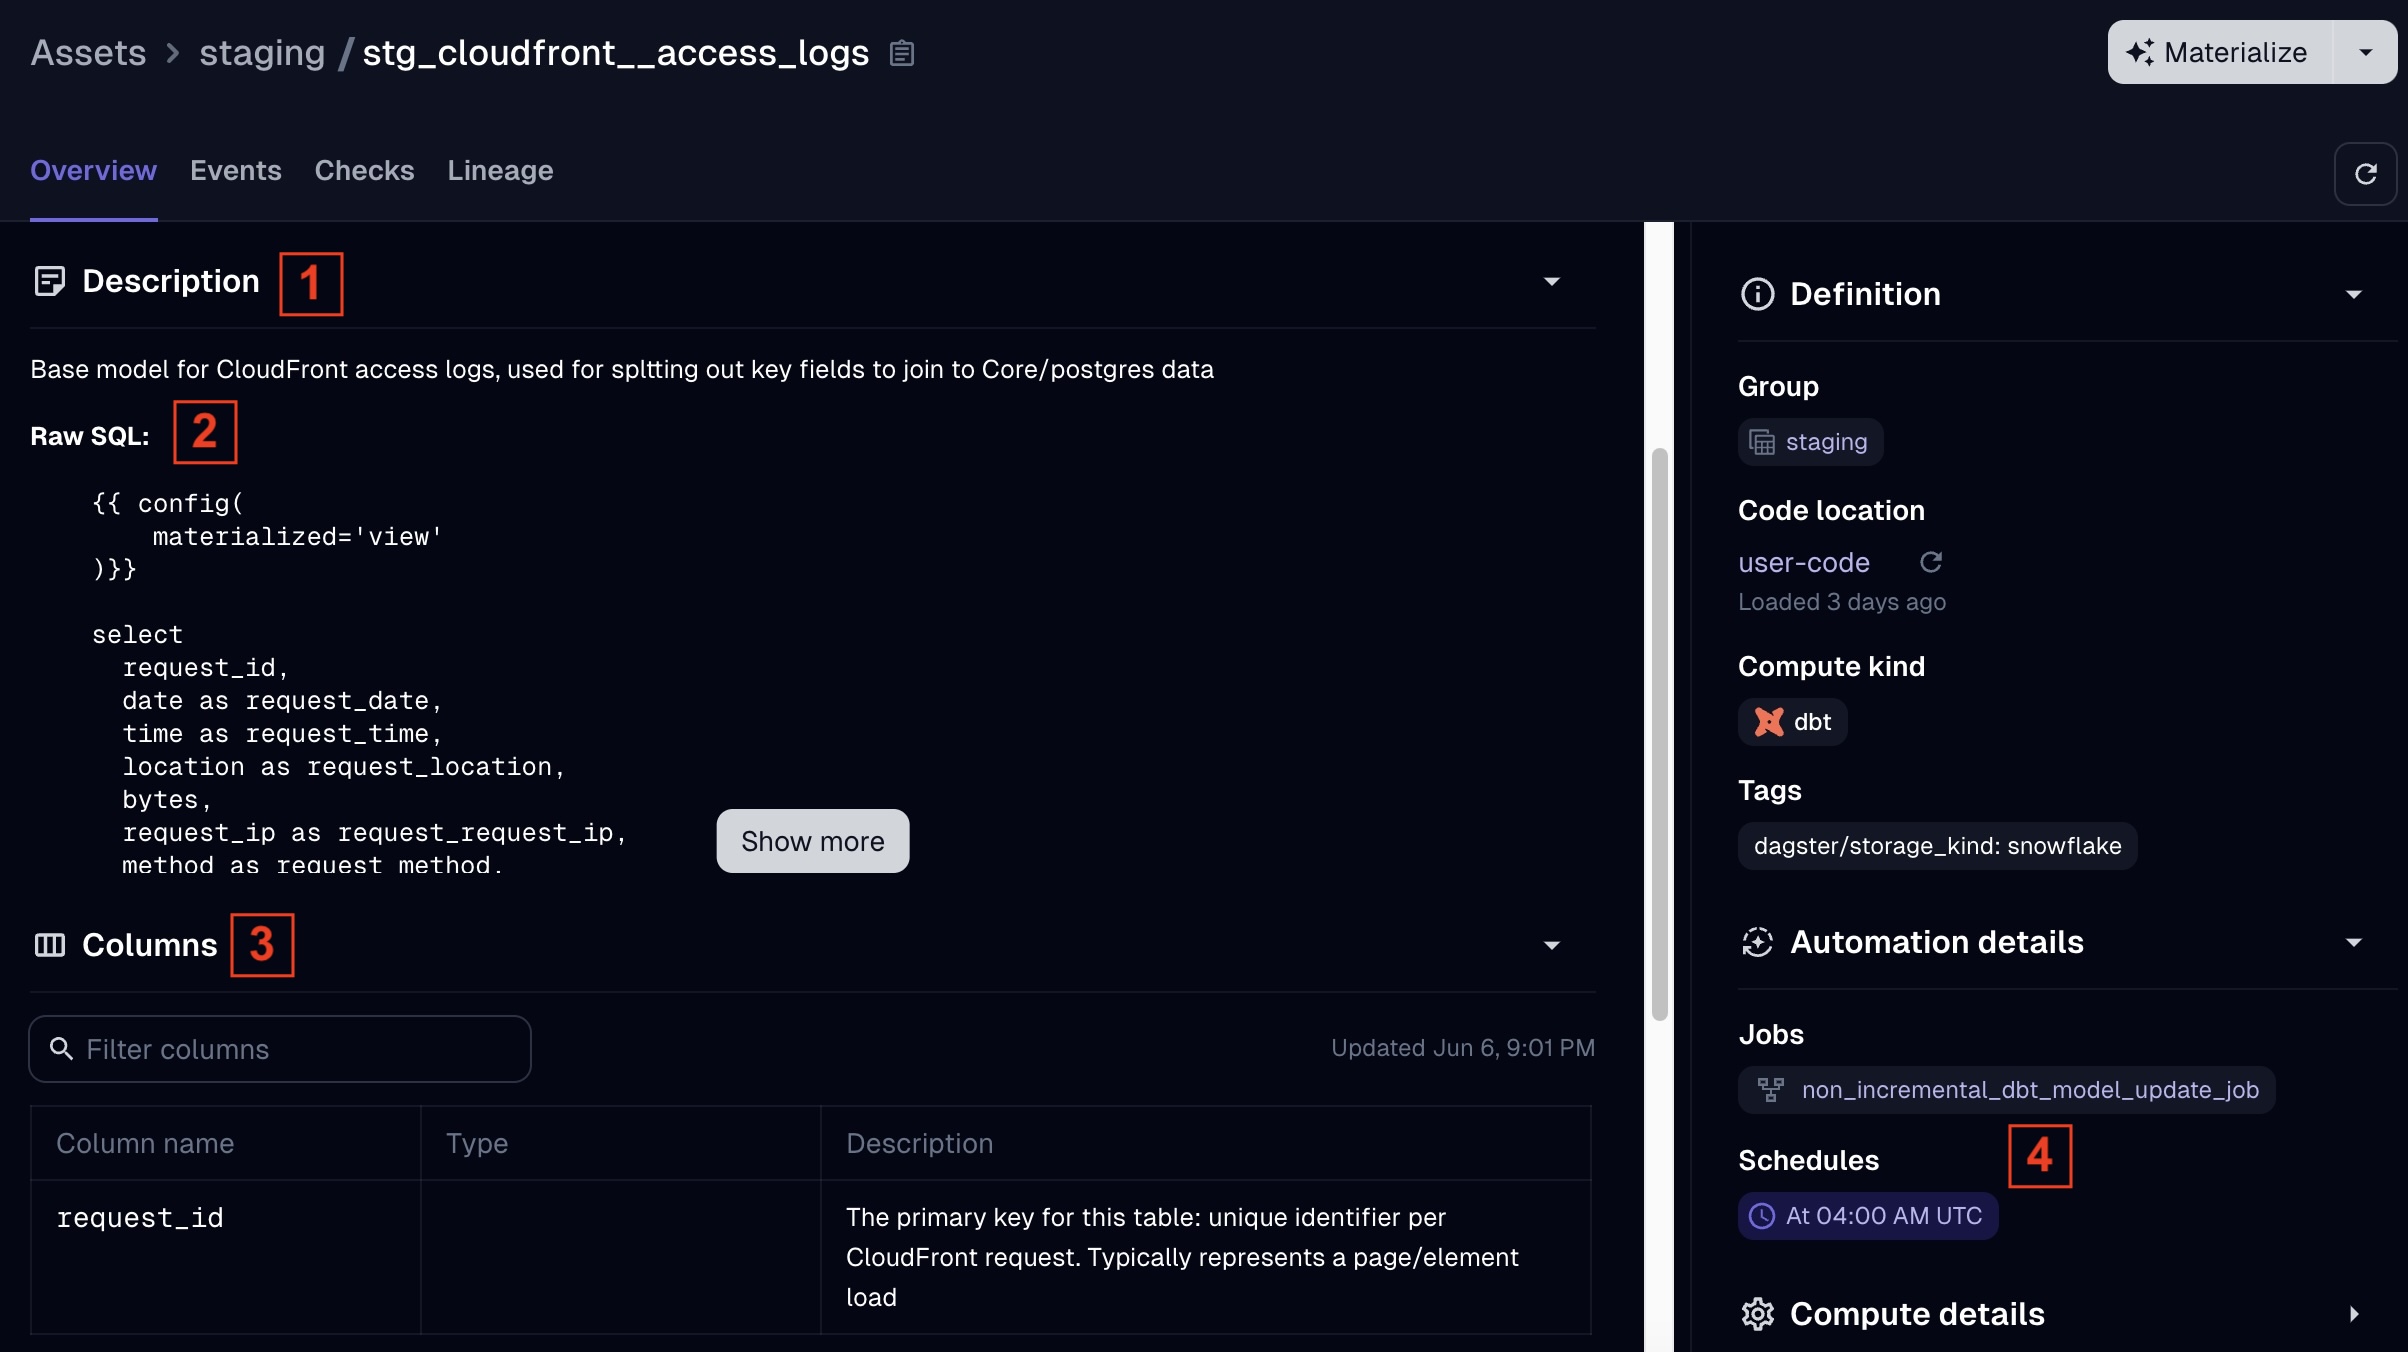
End users can also gain a ton of valuable insights from clicking into a particular dbt model from the "Assets" page in the UI. Dagster populates the following from the .yml in your dbt project (similar to dbt docs) in the "Overview" tab of an Asset:
-
The model's description (from your .yml file)
-
The SQL code used to define the dbt model (from your .sql file)
-
Column descriptions (from your .yml file)
-
The Dagster job that refreshes this model, and the schedule it runs on
dbt docs is a great feature for exploring and understanding your dbt models, but typically requires you to deploy and host your documentation site if you are using dbt Core. Between the lineage features and the ability to view this much information about how your models are defined, the native Dagster UI effectively provides the same benefits and functionality for your end users that a hosted dbt docs site does.
Monitoring Dagster Runs
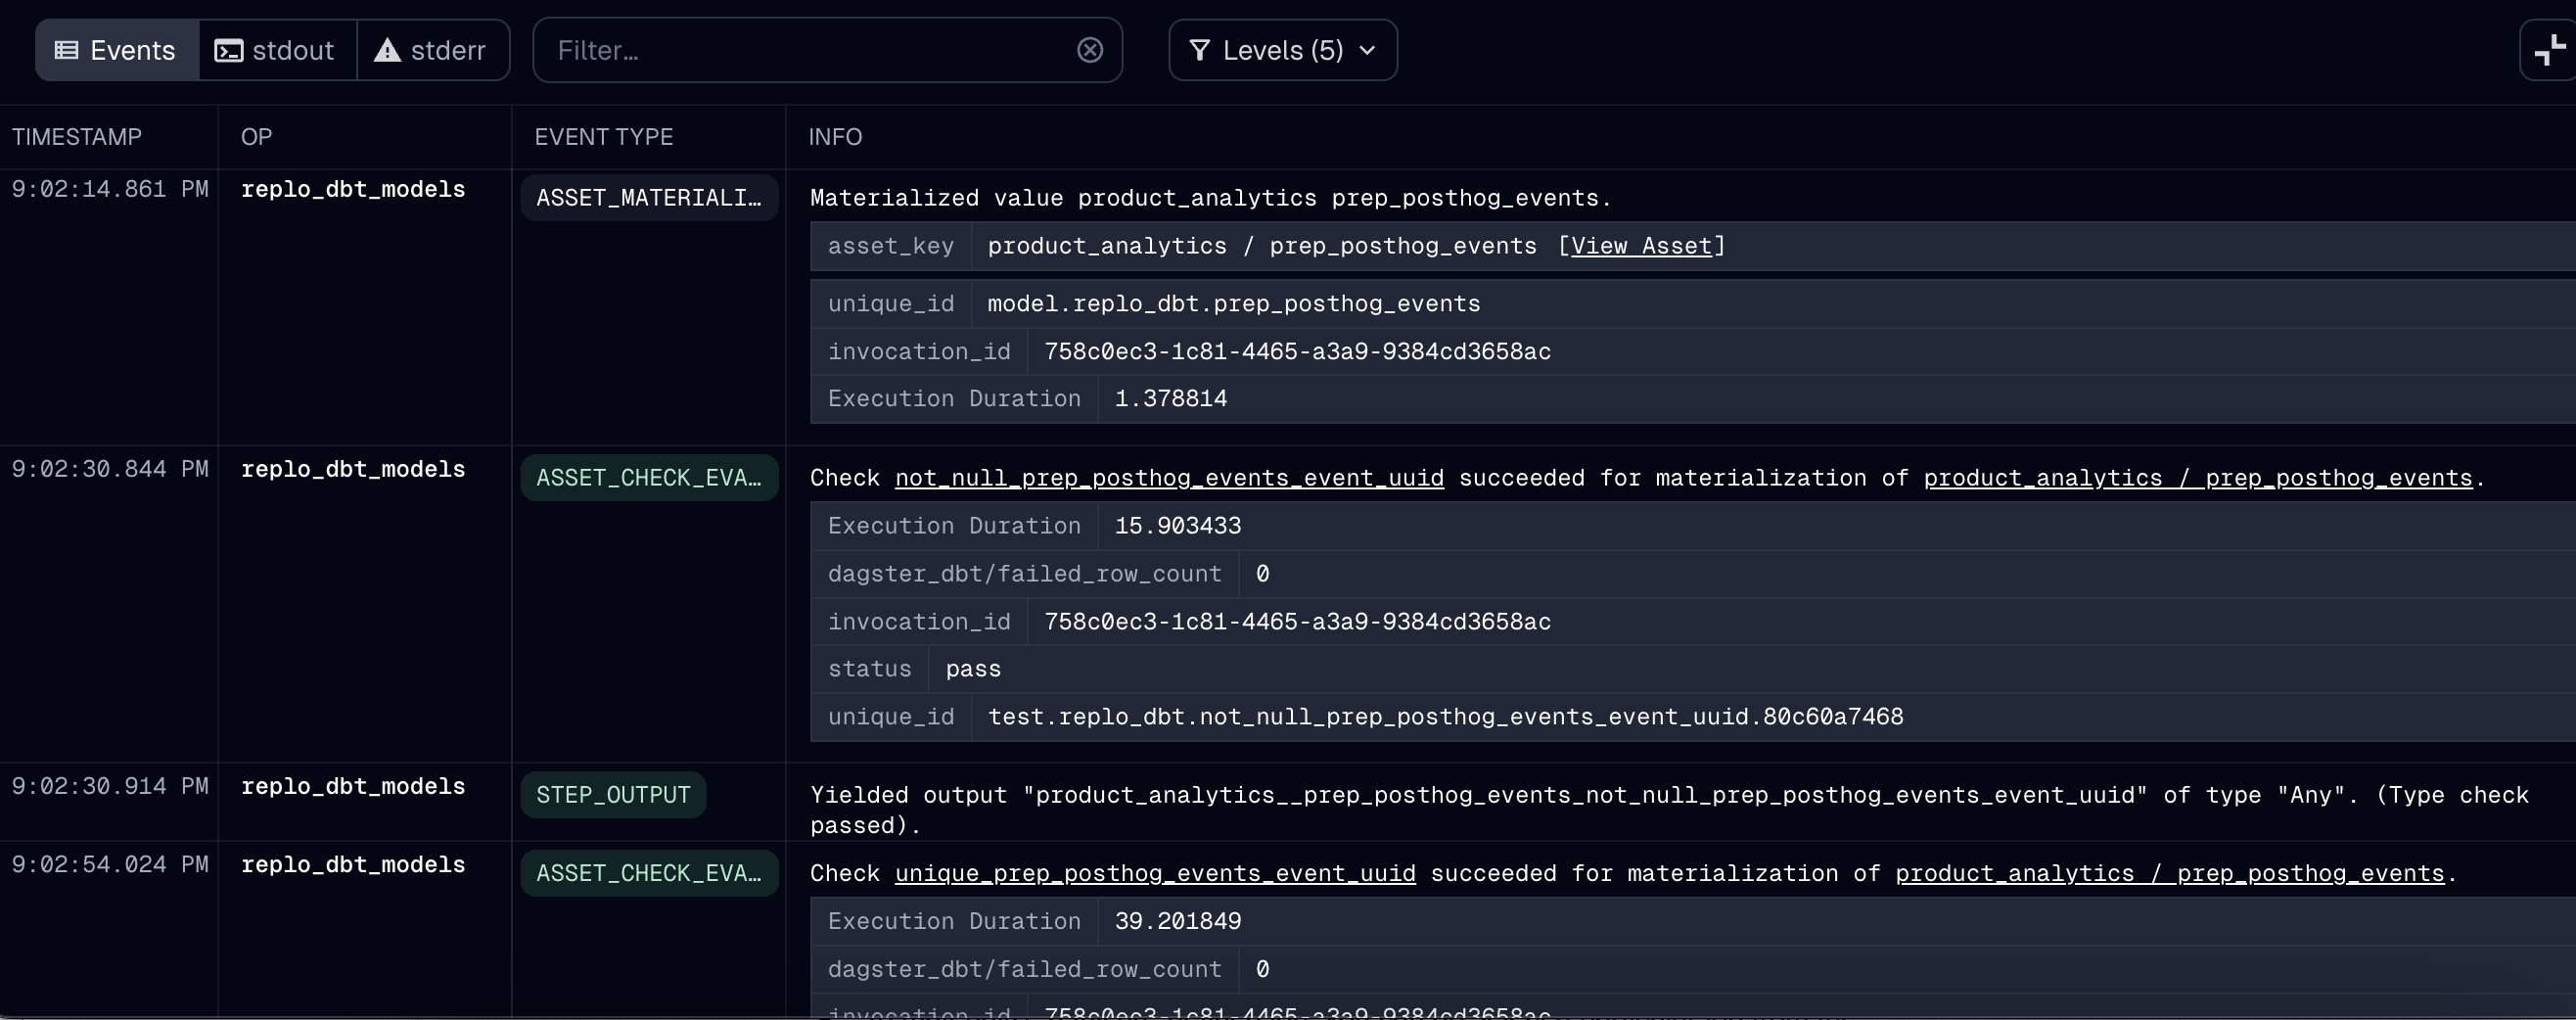
Your business users can also review the timeline and logs of successes/failures in multiple places within the UI (on
the "Runs" tab, or the Jobs/Schedules tabs, etc.). That part isn't particularly unique to Dagster compared to other
orchestrators, but Dagster also provides you with a detailed log of the models being materialized as well as their
dbt tests:

Inspecting Data Freshness
From an asset's overview tab, users can quickly see when a model was last refreshed in production. In the screenshot
below, you can see that the model finished materializing and its two data tests (checking that the primary key is
both unique & not null) all successfully ran at 9:00 PM:
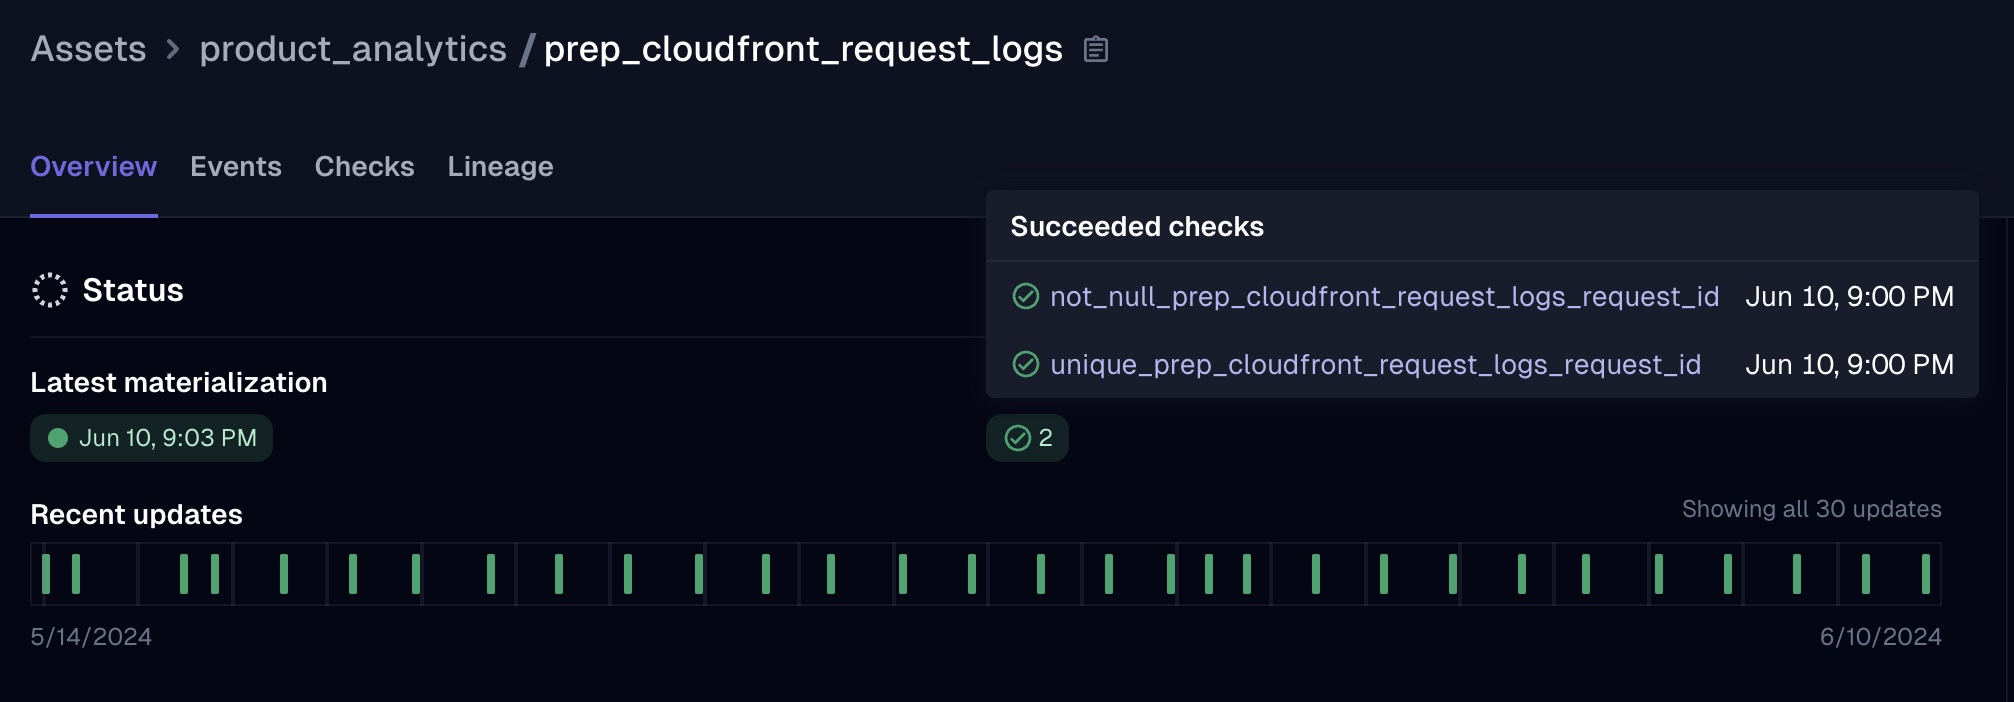
While it's always helpful to know the last time a table was refreshed, anyone that works in data long enough will
tell you that a table is only as up-to-date as its upstream source (i.e. even if a table is rebuilt, it would still
contain stale data if the upstream tables that it references have not been updated in 24 hours).
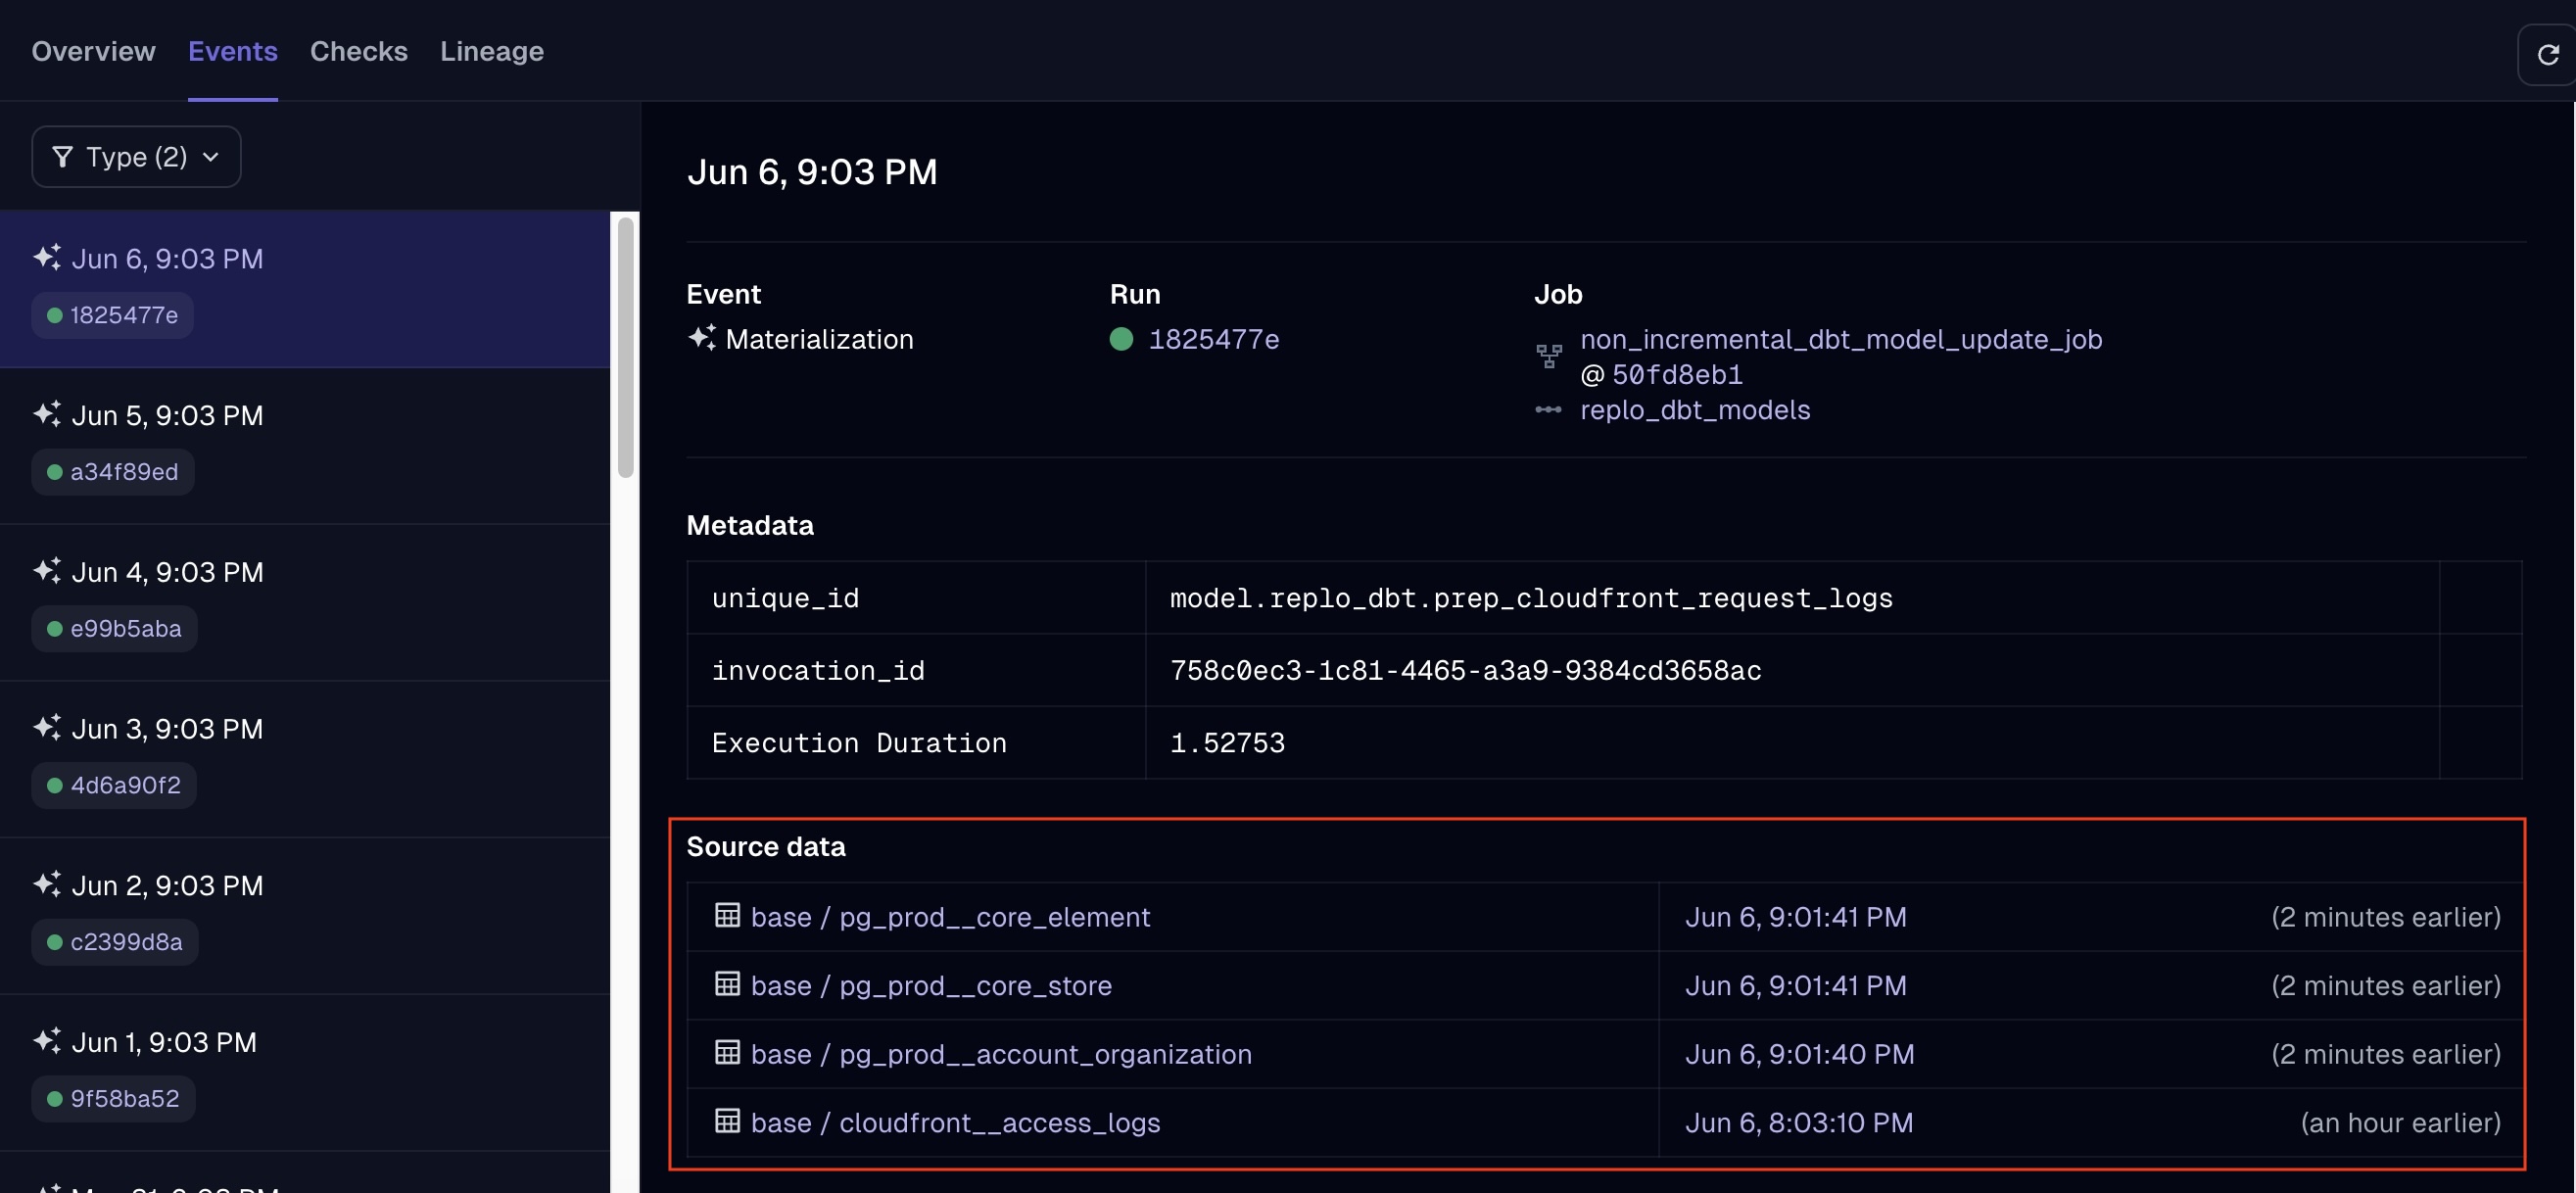
I probably care about this more than most people, but I think the way that Dagster surfaces metadata about a model's upstream sources is one of its best under-the-radar features, and I probably would have used it daily in some of my past roles. In the "Events" tab of a particular asset, you can easily inspect the freshness of a table's upstream sources at the time that the model was rebuilt.
E.g. in this example, you can see that most of the upstream sources were refreshed at 9:01 PM, whereas the
incremental model (which refreshes on a separate job/schedule) was refreshed at 8:03 PM:
Additional benefits of Dagster
Partitions and Backfills
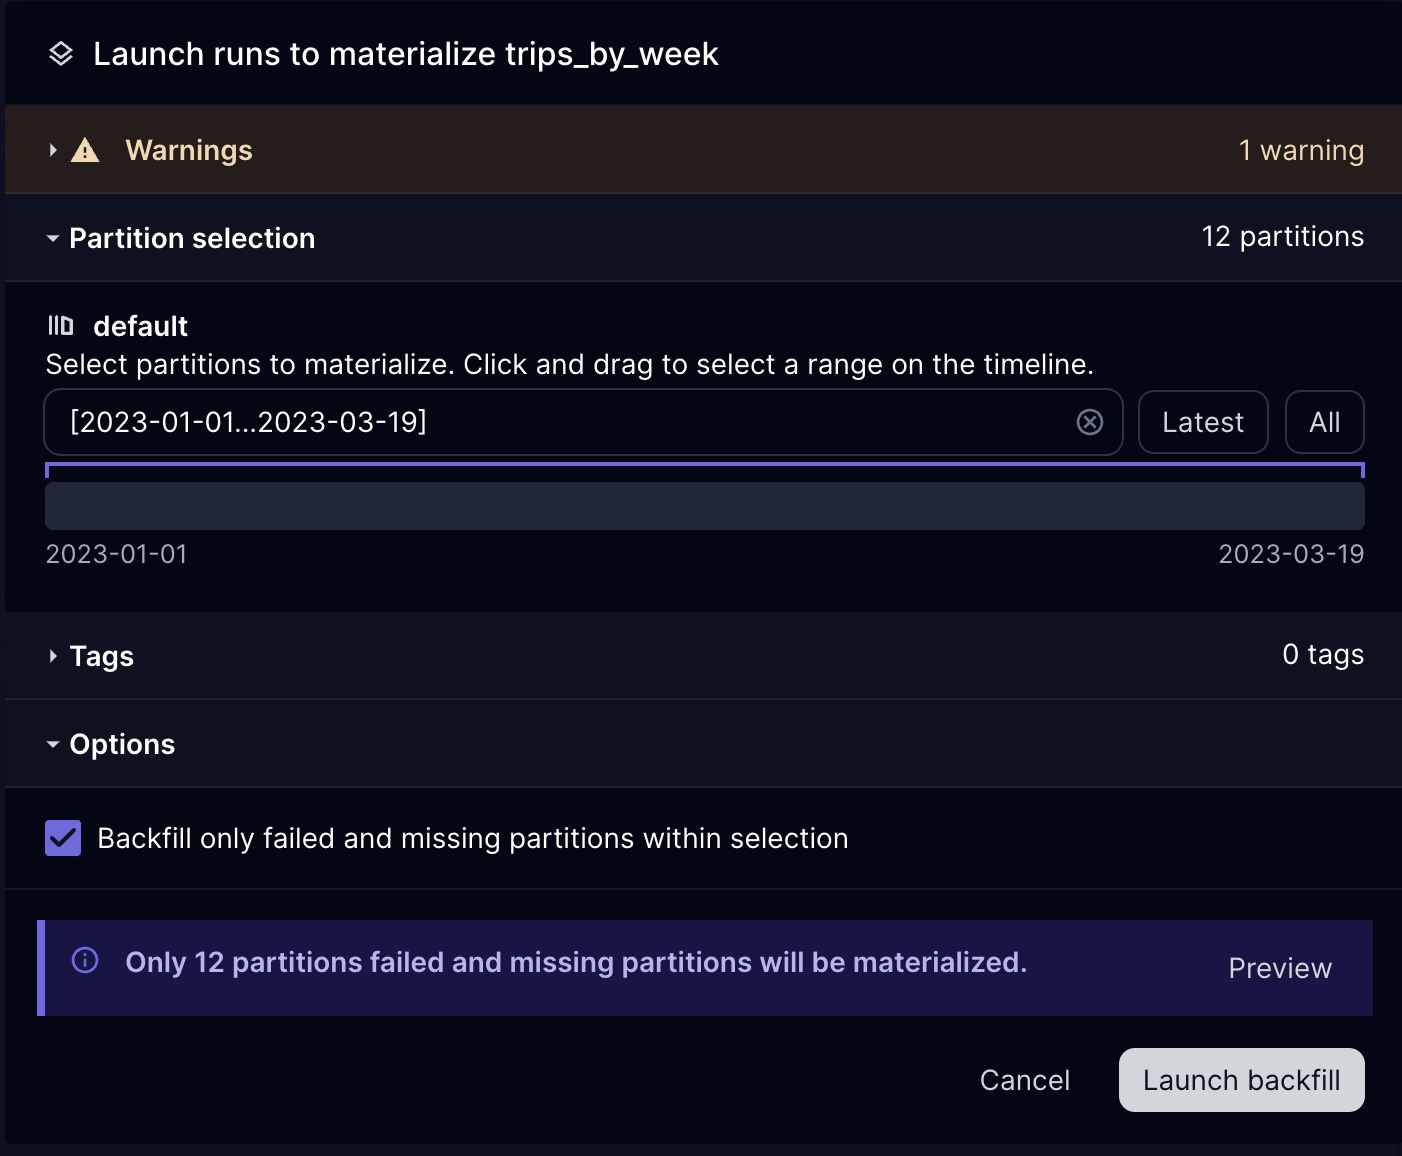
Dagster's native support for partitions and backfills is a nice additional feature, particularly if your dbt project includes incremental models. Partitions allow you to manage your data in chunks (e.g., daily, monthly), making it easier to handle large datasets and incremental updates. This is particularly useful for dbt models that need to process data in time-based segments. Backfills enable you to retroactively process historical data, ensuring that any changes or corrections are propagated throughout your data pipeline. Rather than running a full refresh all at once, you can backfill data in chunks, based on the partitions you define.
Example: If you had partitioned your dataset into weekly increments, you can kick off a run to
backfill only specific weeks
(or only weeks that have not been backfilled or had failures when ran):
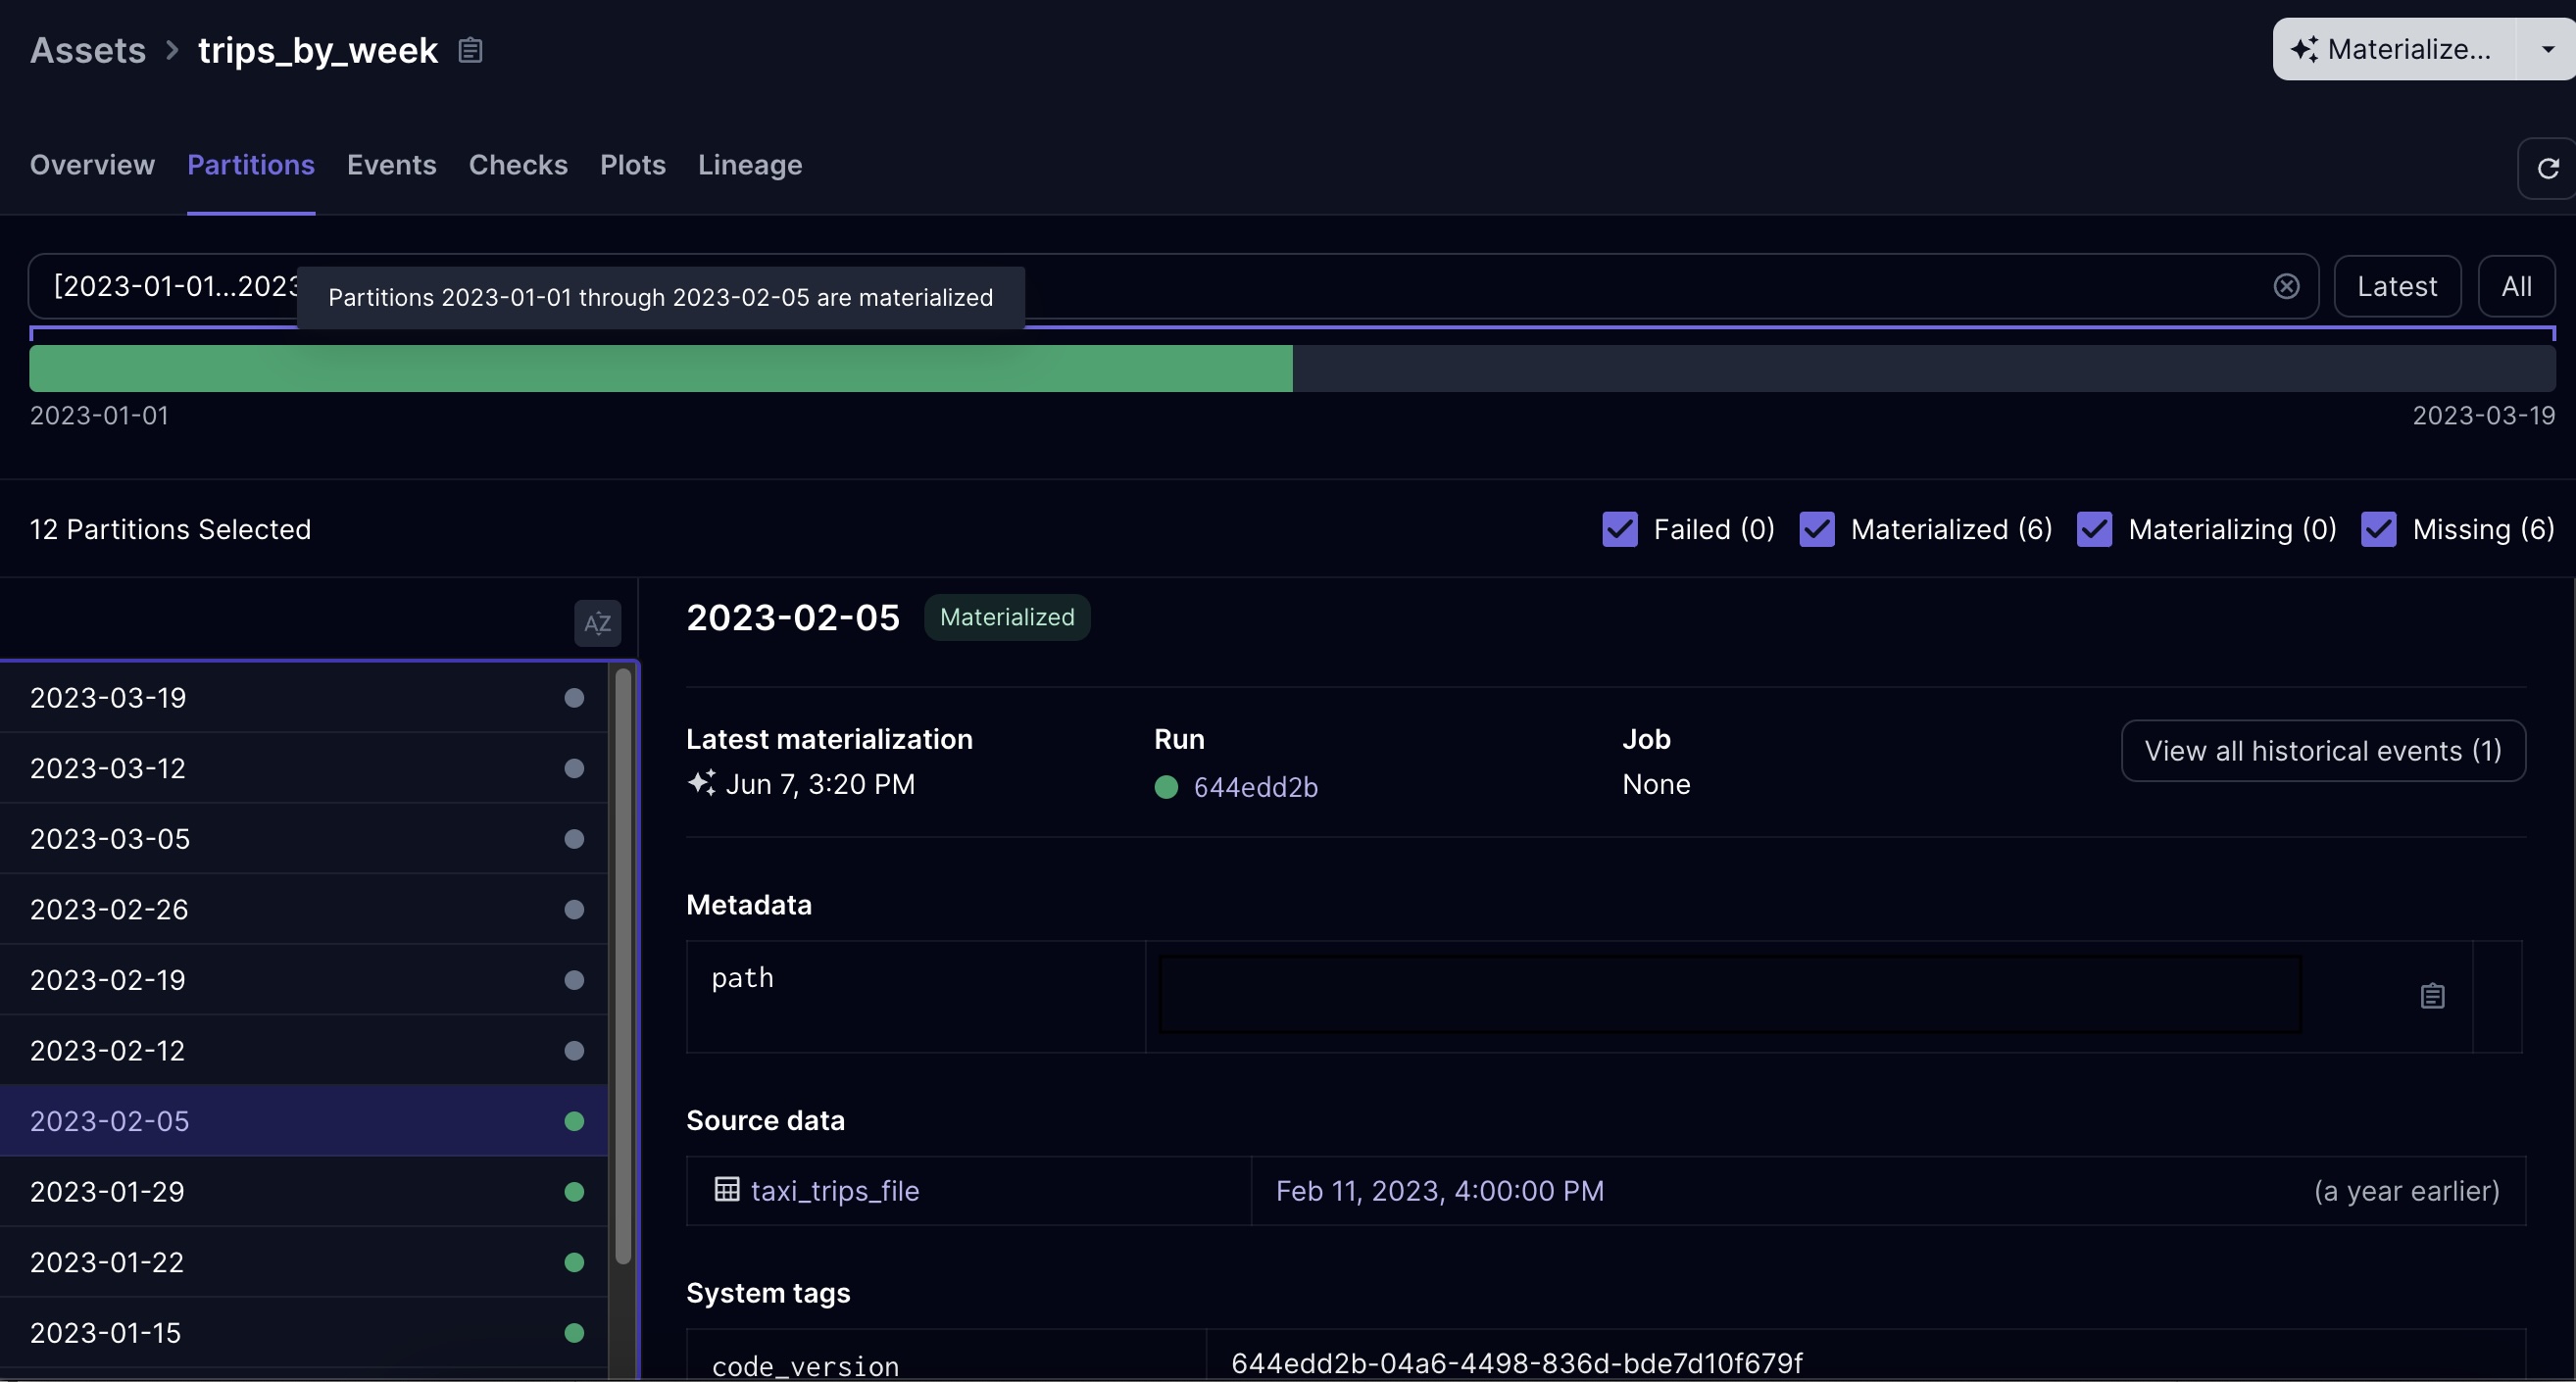
This allows you to monitor and interact with your model at the partition level. E.g. you can see which partitions
have been backfilled (and when), and you can kick off runs for those that have not been backfilled:
Orchestrating the entire data stack
Given the title of this blog post, I've only really been touching on why Dagster works so well with dbt up to this point. But Dagster's orchestration capabilities extend beyond dbt, and can be used to orchestrate your data ingestion as well (with integrations to Airbye, Fivetran, dlt, etc.). This allows you to create more advanced pipelines where you could automatically trigger a dbt refresh of specific models when their source data is updated by tools like Airbyte or Fivetran, ensuring your dbt models are always up to date and reflective of the latest available data.
Conclusion
Dagster and dbt integrate pretty seamlessly, and provide a robust UI for your users to manage your data workflows. I'm not saying this is the only way you should be deploying your dbt project--other solutions might make more sense for your situation. For instance, dbt Cloud might be a better fit for you if you don't want to manage an additional tool and you are mostly running simple dbt jobs that wouldn't benefit from more advanced features that Dagster offers. There isn't a one-size-fits-all solution for everyone, but I wanted to spotlight this approach because I used it on my last project and was pretty darn impressed with how well the two tools complement each other.
Regardless of the approach you choose, the key is to find the tools that best align with your needs and will simplify your data workflows. The landscape of data tooling is constantly evolving, and pairing dbt with Dagster has recently become one of our favorite combinations. Whether you're just starting to build your data stack or looking to upgrade your current dbt deployment and build something like this, come talk to us - we'd be happy to help!