
Abstract
A simple Google search will yield a plethora of marketing articles published about building a data stack–yet there is a frustrating lack of comprehensive literature on the subject.
Decision-makers often find themselves hard-pressed to develop a functional understanding of what is actually needed to set up a scalable, manageable data practice within their organization. The end result is usually a series of investments in a variety of data tools that don’t play well together, leading to a rapid accumulation of tech debt and subsequent deterioration of data quality.
This in turn limits the organization’s ability to make data-driven decisions and/or deploy effective ML and AI products, and eventually leads to expensive migrations from old systems to new ones as the organization learns from their initial missteps.
The aim of this paper is to dive deep on the subject of building a comprehensive data stack that is low-cost, easy to manage, and scales effectively.
Over the next few weeks, we’ll release a series of articles going through everything you need to know about each part of the stack in detail. We’ll start with a high-level overview of the components that make up a standard data stack, and then go into detail on the tooling, costs, and staffing resources required to build it.
As with all publications of this nature, we likely won’t cover everything under the sun that relates to this topic–our goal however, is for this work to be useful.
As we go, we’ll maintain this as a living document and add to it actively based on feedback provided by our readers, with the goal of making this into a reference guide that can be leveraged to make informed investment and resourcing decisions.
You’ll notice hyperlinks scattered throughout this series–They’re designed to aid with comprehension.If there’s a term you don’t understand, click the link and learn more!
Thank you for reading–and please let us know your thoughts!
Who is this for?
This document is primarily meant to be used as a resource for decision-makers within startups or other early-stage organizations (meaning: those without a dedicated data leader whose job it is to do this for larger organizations.)--Those who are ultimately responsible for making the investment and resource allocation decisions related to data.
By the end of the paper, readers should have a foundational understanding of:
1. The components of a data stack–and why they work the way they do.
2. How the tools that service each part of the stack function.
3. Costs associated with each part of the data stack (and strategies to keep those costs low!)
4. The resources (staff) required to build, support, and scale each part of the stack.
Why does the “modern data stack” exist today (and is it really modern?)
Data analysis is by no means a new discipline–humans have used recorded information to guide their decision-making processes since 4000 BC.
While this may come to many readers as no surprise, the reason we bring this up is because the key to understanding what a data stack does and how it works can be found in historical examples of data analysis that pre-date the proliferation of big data that occurred as a function of the rise of the internet:
The 90s were a wild time.
If you work in or around data, you’ve likely seen the 1990 Microsoft Excel elevator ad. Excel was revolutionary in the sense that it allowed users to simply and effectively aggregate information using standard formulas and present that information in myriad ways.
What was previously a complex manual process was streamlined, allowing end-users to process and present findings from datasets that previously would have been too large to grok and easily derive insights from.
Excel was an early solution to the problem of data proliferation, and if you understand the way excel manages that problem, then intuitively you already understand how a data stack works today.
Today’s data stack is just an extension of a solution that already exists, but suited for use cases where the data collected and used for analysis are so large they’re almost impossible to conceive of.
The stack is by necessity more complex than an excel spreadsheet with a few tabs, but the underlying workflows it supports are almost exactly the same:
The Excel Analogy
As an introduction to the process of understanding what a data stack is and what it does, we’ll use a hypothetical data analysis workflow using Excel as a contrived example to mirror the steps our stack takes to get us to the insights or to the model deployment we want:
1. Storing the raw data
This process is a fundamental part of computing. Files like the .csv in our example are stored in folders on a server that can be accessed via a computer network. All software applications use servers to store and move data to and from one place to another.
Let’s use payment transactions as an example: Let’s say our software is a payments system that allows users to send money to one another. When you make a payment, the information related to that payment is recorded. The application gives that transaction a unique identifier (i.e. a transaction number) and stores all of the information related to the transaction along with the other transactions on a server (i.e. your customer number, your name, bank account info, etc.).
The file or files created each time a transaction occurs are stored on that server until the time they are needed. This is one of the core components of computer storage, and is how the majority of the data we use is generated and collected in its raw form.
2. Getting the data into Excel
Generally, data is dropped into Excel in the form of a .csv file. You have a machine-generated copy of the data that isn’t easily legible by a human–and Excel (and you!) do the work to disambiguate rows and columns and present the information in a way that is easily legible.
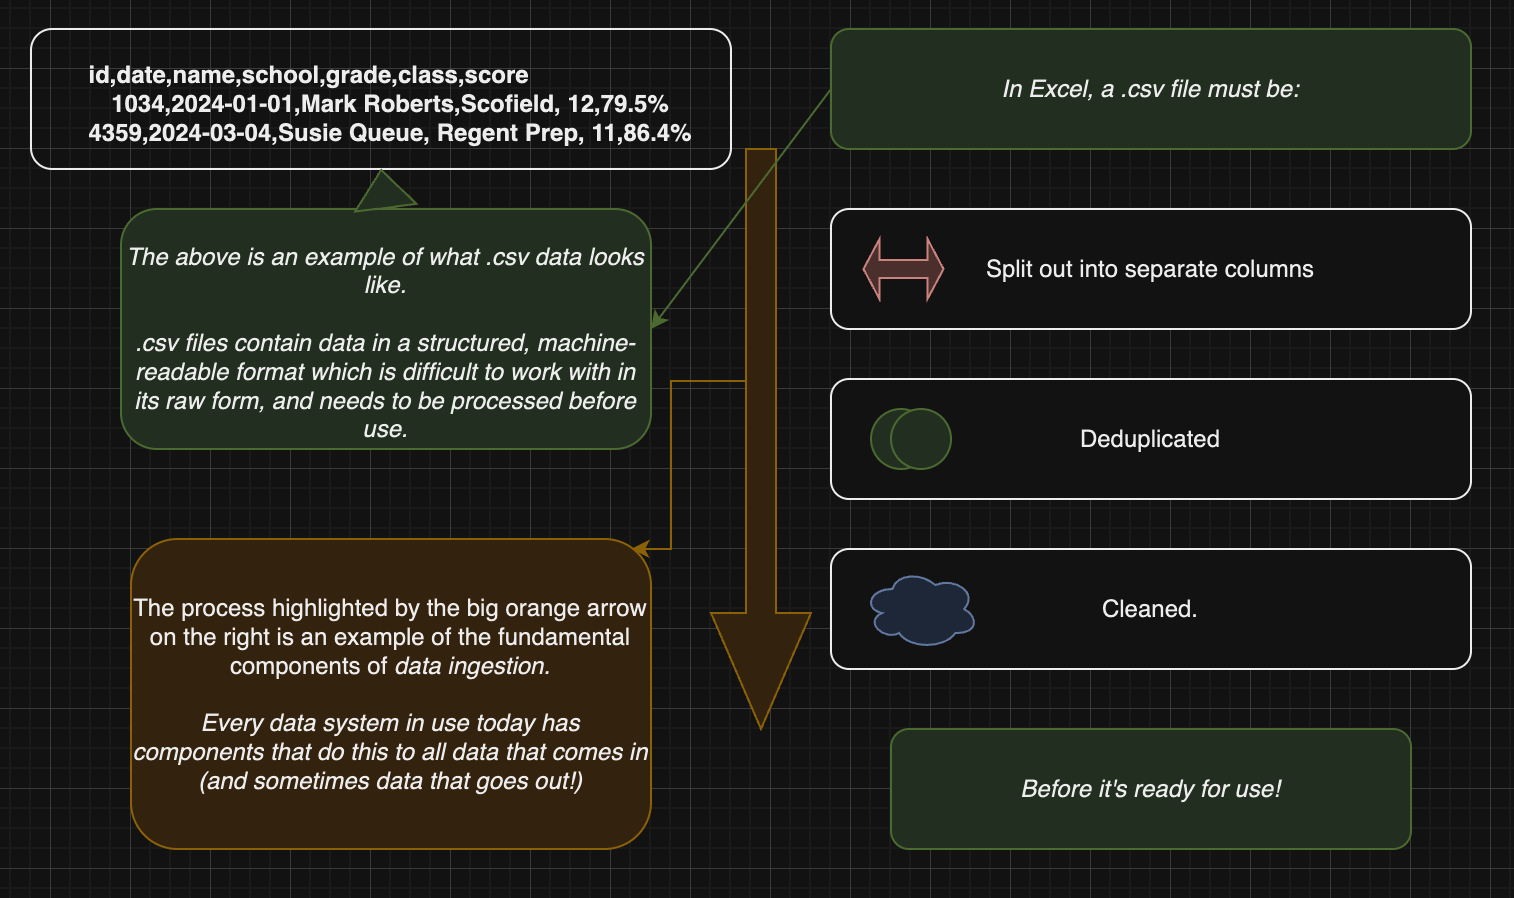
This is a rudimentary example of what people call ingestion. Simply put, ingestion is the process of collecting data from wherever it’s produced and stored in its raw form–in this case, in a .csv file–and pushing it into a data warehouse, where it can then be transformed (read: cleaned, simplified, aggregated, and analyzed or pushed back to a software application’s front-end–but we’ll talk more about those things later).
In today’s world, we often have multiple sources of data that we want to store in one spot and combine rather than just one or two .csvs to load, and we use the process of ingestion to do that.
Instead of manually clicking and dragging, or copy/pasting, we use a tool that interacts with third-party vendor APIs (i.e. CRM tools like Salesforce) or cloud storage environments (think Amazon S3 buckets or Google Cloud Storage), and pulls the data out of those tools and into our data warehouse.
3. Transforming the data
Once the data is loaded into Excel, we usually have to do some work to get it ready for use. Transformation is really just a fancy word to describe the process of cleaning and reformatting data into a form that makes it usable for a particular purpose. That purpose could be making visualizations for a report or dashboard, feeding it to an AI or ML model, or piping that data back into the same application in a different format.
In Excel, transformation can either be done manually or programmatically. An example of manual transformation in Excel is using the filtering feature to narrow the dataset to only include the desired records, or the “remove duplicates” feature to remove duplicate copies of records.
You may also want to combine records from two or more csvs: provided there’s a matching column shared between the datasets, you can use formulas in Excel like vlookup, hlookup, index, and match to pull records from multiple datasets together into a new dataset.
Another common form of data transformation is aggregation. Using the same payments example: An analyst using a dataset of individual transactions may use aggregate functions like sum() or count() to roll up all the transactions that occurred within a given month to create a new dataset that can be easily charted, and changes to the transaction volumes over time can be easily understood.
It is also possible to use VBA, Microsoft’s event-driven programming language, to automate these steps further, so that you can clean your datasets at the click of a button.
No matter how you transform your data, the desired end result is a “clean” dataset that is ready for use.
Today, we use a transformation layer supported by a data transformation tool like dbt that allows us to write code to programmatically reformat the data in whatever way is required to make it usable downstream.
We use the programming language SQL, or sometimes Python, to interact with the data warehouse to reformat data, pull data as needed, and send it where it needs to go.
When we talk about data transformation, we’re really talking about a series of steps (usually a mix of standard and unique steps, depending on the use case) we take to clean and reformat the data just like an analyst would do manually in Excel.
4. Using/Presenting the data
The last step in the process is the use/presentation of data. In Excel, this usually amounts to creating a table or chart that clearly shows trends in the data in a way that is human-readable and can be used to inform decision-making.
In modern cases, the presentation depends on the use case. In analytics, the presentation layer functions basically exactly the same way, with the end result being a dashboard or report that can be updated manually as needed, or automatically on a set cadence.
In data science/machine learning, the presentation layer is replaced with what we’ll call a deployment layer, where our clean data gets piped into an AI or ML model as training and input data. The model’s outputs are recorded and either stored back in the data warehouse, visualized in a presentation layer, or both.
5. Automation
The one big difference between our contrived Excel example and the modern data stack is that a lot of the processes that are semi-automated or done manually in Excel can be made infinitely less time-consuming with the addition of automation.
A common buzzword you’ll hear in the data space is “orchestration.” Orchestration is the process of automating the loading and transformation of data and scheduling it to occur on a regular cadence.
Orchestration can get complicated quickly because a large part of the process involves setting up automation in a way that is computationally and monetarily inexpensive. It’s also very important to get right because it controls the flow of data from one part of the stack to another and effectively touches all parts of the stack in one way or another.
An additional complexity involves the automation of decision-making in the event a particular job fails (i.e. conditional settings like “If job_x passes, then run all jobs. If job_x fails, then run only job_y.”). Improper conditional automation can add complexity to your DAG or even cause failures and limit end-users’ timely access to the data they need to do their jobs.
Improper data orchestration is often the leading cause of ballooning bills from database and data orchestration companies that provide these services, and failures in orchestration usually result in faulty data or lapses in service to end users (i.e. the dreaded “Hey @data-team, my dashboard looks weird…” Slack message). For this reason, orchestration is a key part of the data stack that is often shrouded in mystery and complexity.
We’ll go into more detail on the subject in the sections below–but for now, just remember that besides orchestration tools, the other tools (transformation, visualization) that make up the modern data stack are effectively replicating the workflows that analysts would do in Excel, but at a much larger scale and level of complexity.
That’s it for the Excel analogy–hopefully you found this useful and are ready to dive deep into each individual part of the stack. Next week we’ll move on to our first in-depth topic: Cloud storage.