Complexity is often mistaken for quality. While simplicity doesn't always guarantee higher quality, our rule at Snowpack is to start with the simplest solution that performs well, and then introduce complexity only as needed. In a recent project we were able to model complex conversion behavior in a funnel-based forecast as simple, understandable steps that resulted in a highly informative and accurate forecast.
This case study demonstrates how we developed a simple, straightforward statistical model that outperformed the complex legacy heuristic system it replaced.
The Business Challenge
Our client, a technology company with a long sales cycle, needed to make daily operational decisions about marketing spend when their actual conversion data wouldn't be known for months. They allocate daily online advertising campaign budgets, but they operate with murky short-term and long-term conversion guidance. This ambiguity resulted in difficulty adjusting short-term budget allocations and measuring CAC across different channels in the long-term.
The core challenge was twofold: First, for any given day or week, they needed to forecast how many of the leads they had generated in the current cycle would eventually convert at any point in the future. Second, if they were to continue acquisition at their current run rate, what would those monthly conversion rates and subsequent CAC look like? This information was critical for making real-time budget decisions and staying within their target CAC while hitting monthly volume goals.
What Went Wrong with the Existing Model
When we arrived, our client was using a heuristic-based model that looked sophisticated on the surface but was fundamentally flawed. They had created 19,000 separate heuristic permutations based on various lead characteristics: source channel, day of the week, firm type, and dozens of other variables. Less than 10% of these permutations had meaningful sample size, and the other 90% were introducing noise. Additionally, short-term bias introduced a significant course correction that led to a high degree of thrash for the business teams managing paid spend.
This resulted in situations where a lead might come in and get assigned a conversion probability of 0.0012% based on its specific characteristics, while another similar lead might get 17% based on a slightly different combination of features. Neither number was founded in statistical reality because the system was drawing from such a wide distribution. With such sparse data, forecasts could change drastically day to day and even intra-day. The business team told us they didn't trust the forecast for the first 15 days of each month, and even throughout each day, the predictions were less trustworthy early in the day before ad budgets had been spent.
This is exactly the kind of over-engineering trap that experience teaches you to avoid. The model was trying to make predictions rather than modeling the actual business behavior we needed to understand.
Back to Basics
Going back to my chemical engineering background, I remembered a crucial lesson: when you measure something like fluid flow through a pipe, it can look incredibly complicated. You could try to create a linear equation with 500 variables to model every tiny variation, but make the pipe just a little bit bigger and your model fails completely. It's overfitting, but it's also a failure to understand the underlying problem.
All fields of engineering teach you to break down complex behaviors into simpler, composable steps that you can actually understand and model. That's exactly what we needed to do here. Instead of trying to predict conversion rates through thousands of heuristic permutations, we needed to model the fundamental business process: how leads move through each stage of the funnel over time and at each stage in the funnel what are they likely to do.
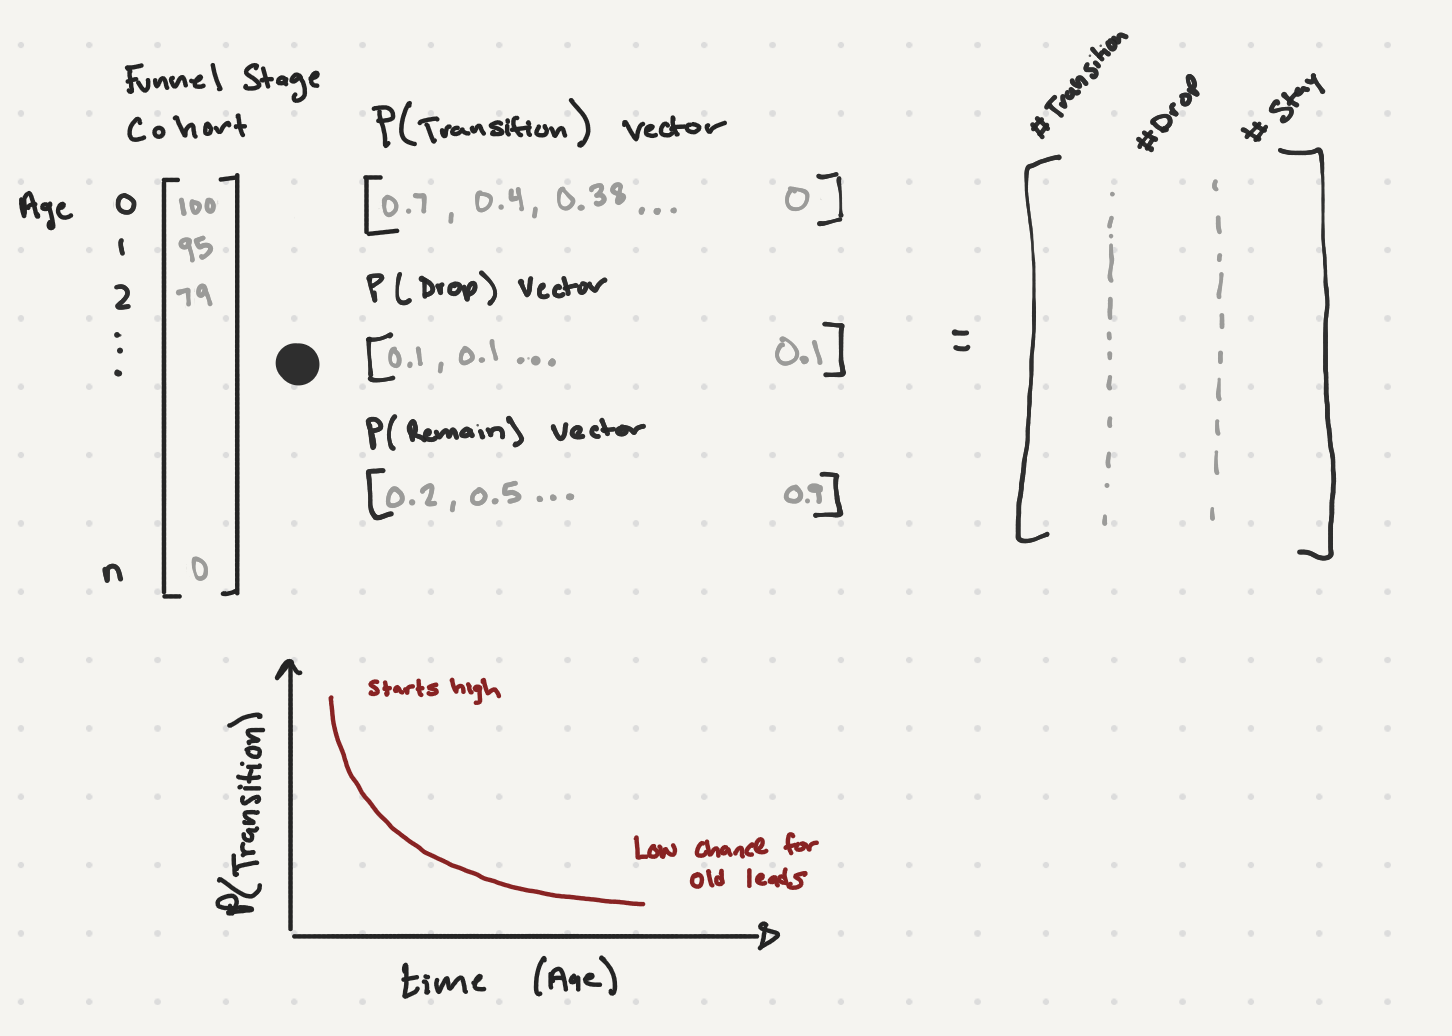
Two classic core data science concepts immediately came to mind: decay curves (the likelihood to convert is often inversely correlated to time spent in the funnel) and Markov chains (for combining probabilities over time when simulating movement through sequential stages).
Building the Markov Chain Solution
Our solution centered on calculating hazard functions—the probability of conversion at each stage over time—and using a Markov chain to simulate lead movement through the funnel. But this is where art meets science: we needed to choose data splits that were large enough for statistical significance while still being meaningfully different in terms of behavior.
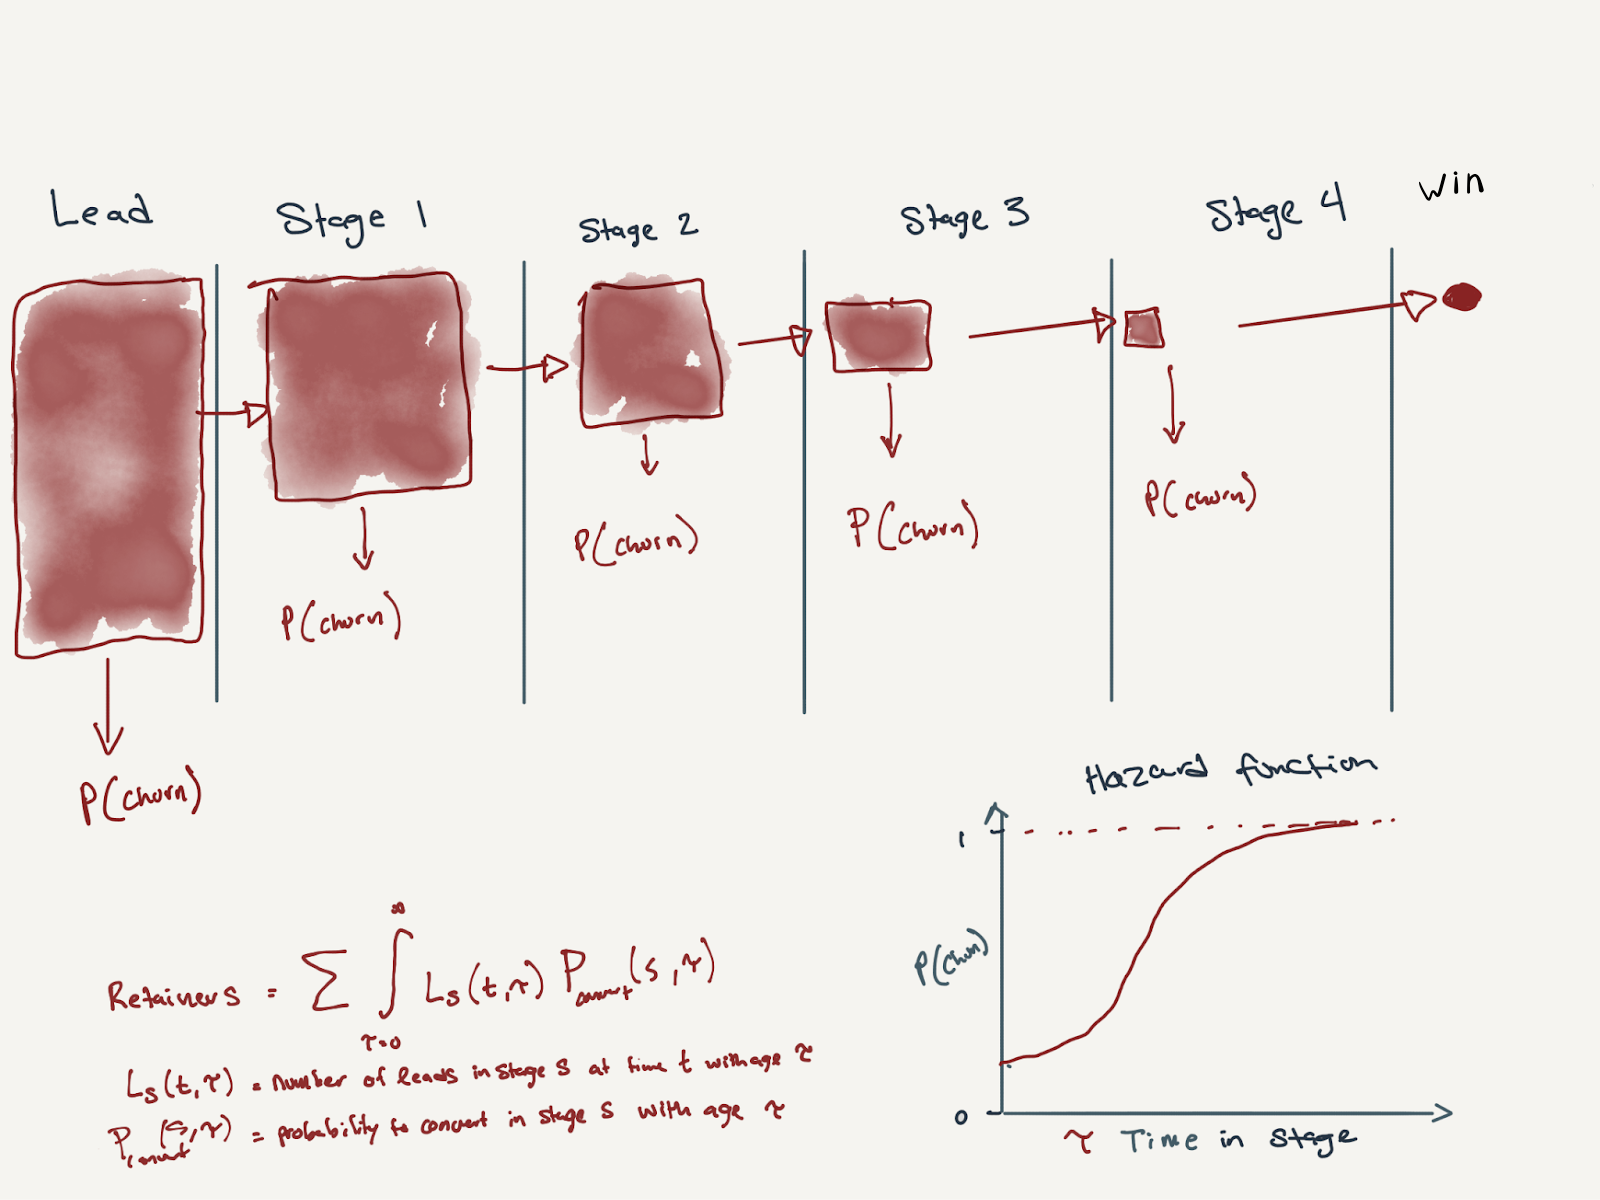
Markov Chain Conceptual Diagram
We discovered that different lead types had dramatically different hazard functions. One type might convert much faster than another, while a third might convert at the same rate at infinity but much more slowly. By splitting our analysis by case type, we could model each stage of the funnel with statistical rigor.
The model essentially looks at the current state of the funnel each day, including features like age, lead type, and other features, and simulates forward using our Markov chain. If we have 100 leads that are 100 days old in stage one, we apply the appropriate hazard function to determine how many move to stage two, how many stay put, and how many drop out entirely. We add a random variable function to account for real-world variability, then simulate this process thousands of times to get upper and lower bounds for our predictions.
Simplified Mathematical Outline of the Forecast Model
Modeling the Human Element
One of the most fascinating aspects of this project was discovering that we could successfully model very human behaviors within our statistical framework. For example, leads that sit in the funnel over weekends don't just pause—they build up what I call a "spring" of energy. Come Monday morning, these leads convert at a higher rate because the customer has been waiting all weekend for the business to open, ready to move forward.
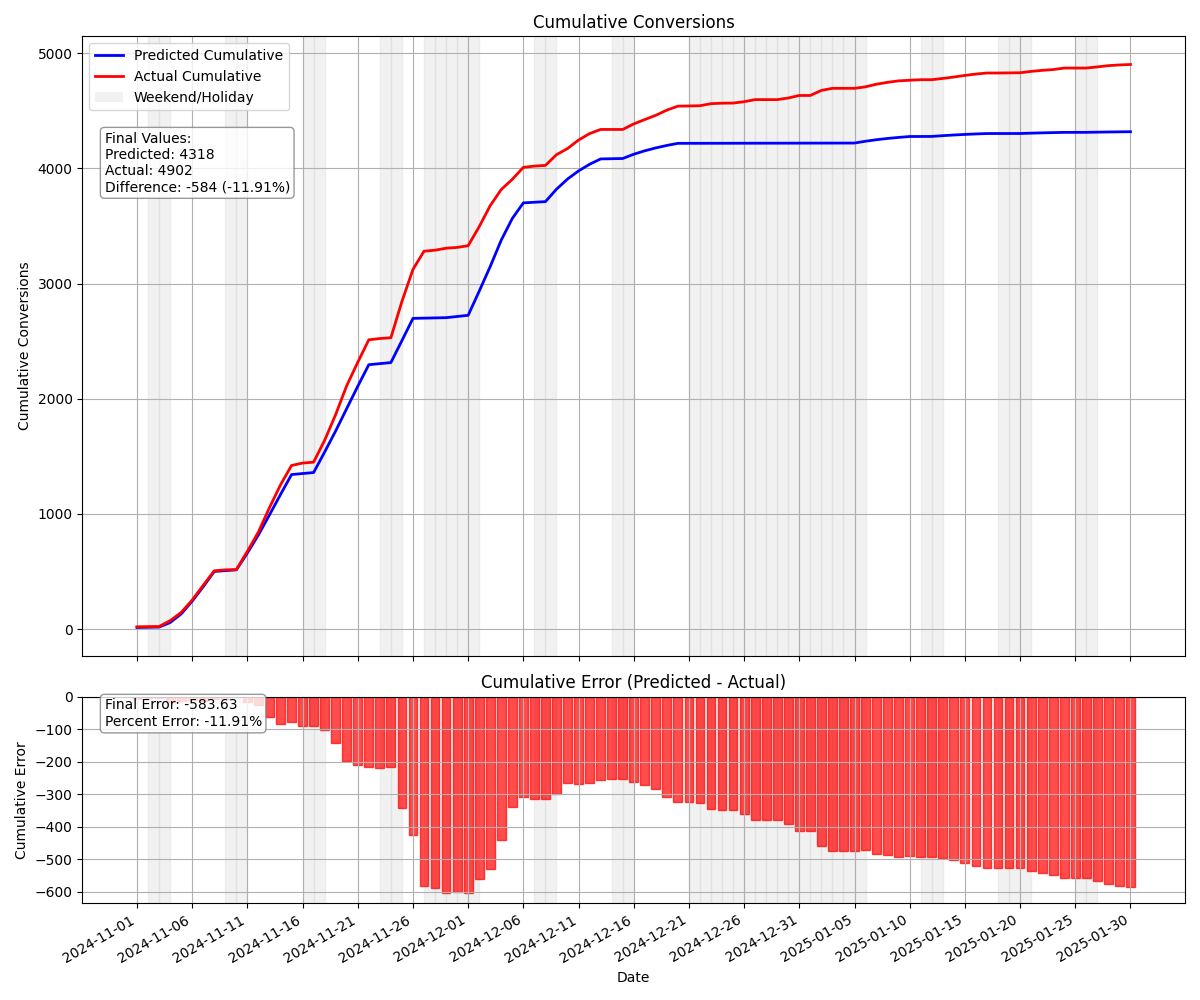
We used Cox proportional hazards to model these weekend and holiday effects as modifiers to our base hazard functions. When we plotted actuals versus predictions, the weekend effect was the first thing that jumped out—we couldn't ignore it. Initially, we just dropped the conversion rate to zero on weekends, but that didn't work because leads continued to age, and Monday didn't show the conversion spike we'd expect.
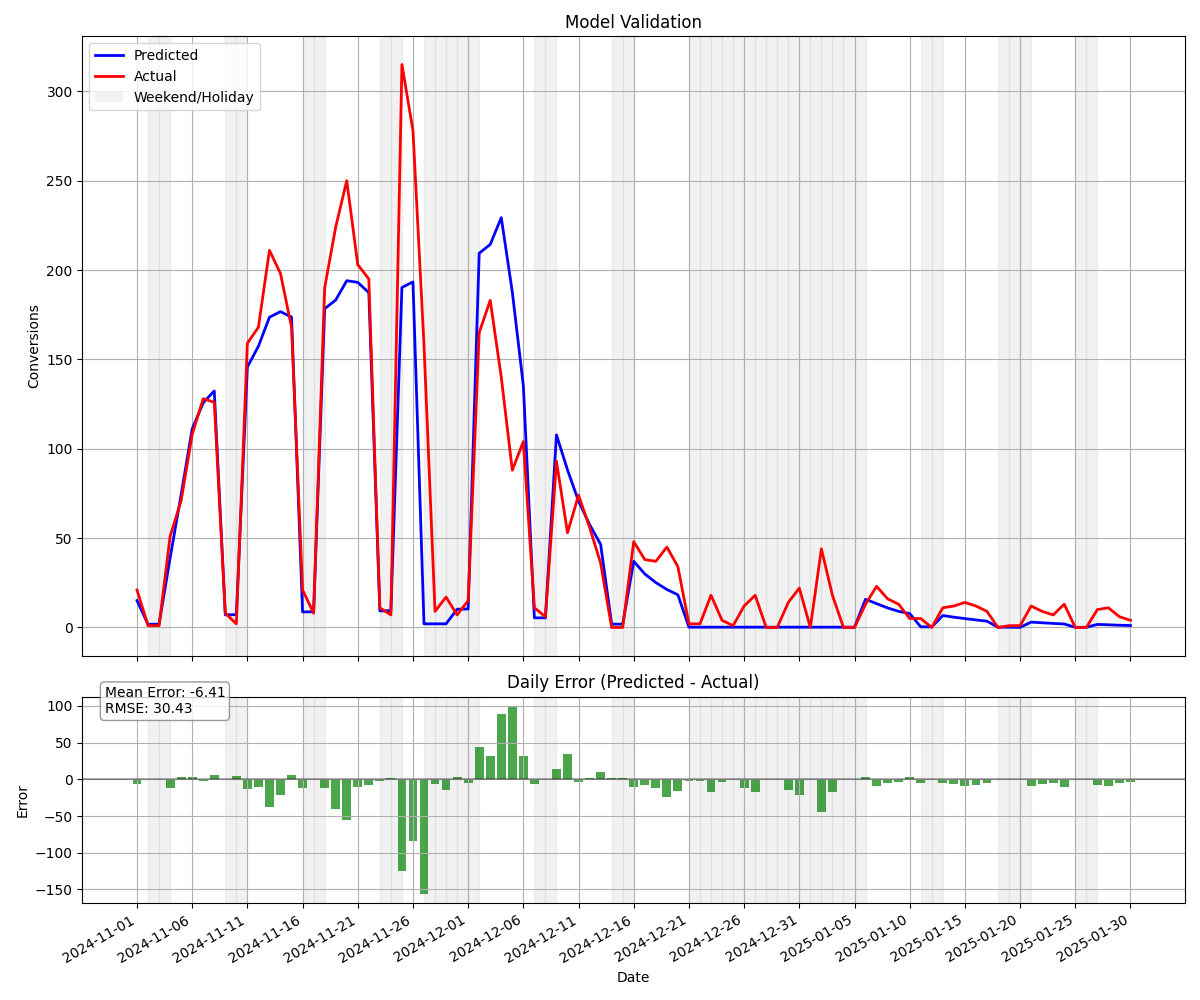
Validation Forecast that Demonstrates the Weekend Effect
This led us to think more deeply about what was actually happening under the hood. After talking with business leaders, they confirmed our hypothesis: leads enter new funnel stages on Friday and spend the weekend "antsy" to move forward. Modeling this human behavior pattern significantly improved our forecast accuracy.
Tuning for Business Reality
The final crucial piece involved understanding what we were actually trying to optimize. In forecasting a common metric is Mean Absolute Percentage Error (MAPE) or Weighted MAPE, calculated by measuring error at each daily point. But we were far more concerned with aggregate bias in our forecast. Our goal was to ensure that our forecast simulates actual behavior as time trends towards infinity so that we can better understand the current state. We relied heavily on tuning our bias as closely as possible to zero on the aggregated forecast rather than worrying about daily conversion MAPE or WMAPE.
One additional touch that we added to the Markov chain to model real world behavior was a "dropout" probability—some small chance that a lead would instantaneously exit the entire funnel at any time. We didn't have much information to capture this but worked with business users close to clients to get a handle on what this behavior looks like and experimented with adding it to our model. These kinds of realistic touches, while small, significantly improved the model's real-world applicability.
An early validation forecast shows strong early performance but a bias that increases over time. (worry not the final forecast is unbiased)
Why This Approach Works
The success of this project wasn't just about the technical implementation—it was about understanding the business context and choosing the right tool for the job. The Markov chain approach succeeded where the heuristic model failed because:
- Statistical rigor: Instead of 19,000 sparse permutations, we focused on meaningful splits with adequate sample sizes
- User behavior modeling: We simulated the actual funnel process rather than trying to predict outcomes without understanding the mechanism
- Operational reality: We accounted for real-world effects like budget timing and human behavior patterns
- Appropriate optimization: We tuned for aggregate accuracy rather than daily precision, matching the business's actual decision-making needs
The contrast with our client's previous approach illustrates a crucial point about modern data science: the sophistication isn't in the complexity of your model, it's in understanding the problem well enough to choose the right level of complexity. Sometimes the most elegant solution is also the simplest one.
Looking Forward: The Value of Principled Simplicity
This project reinforced something I see repeatedly in analytics work: businesses often confuse the sophistication of their models with their effectiveness. I've reviewed presentations where a team has implemented a model that pushed the boundaries of technical prowess, but fell short on actual performance. The temptation is always to add more features, more complexity, more "AI" to the solution. But the real value comes from understanding your problem deeply enough to know which complexities matter and which are just noise.
In our case, the chemical engineering principle of modeling complex systems as simpler, composable parts led us to a solution that was both more accurate and more actionable than the over-engineered alternative. The client could trust the daily forecasts, make confident budget decisions, and actually understand why the model was giving them the answers it did. An added bonus is that markov chains are amazing for "simulation" experiments. What if we were to increase the hazard rate for a certain step of the funnel, how would that change our forecasts? What if we enabled conversions over the weekend, what might we expect to happen?
This kind of principled approach to analytics—combining technical expertise with deep business understanding—is exactly what sets apart teams that deliver real value from those that just deliver impressive-looking dashboards. The next time you're facing a forecasting challenge, remember: the goal isn't to build the most complex model possible. It's to build the right model for the problem at hand.